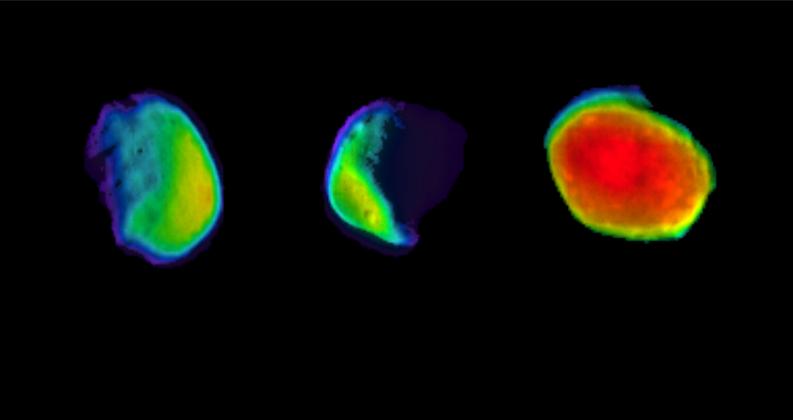
Candy’s Bad for You

The image above was released as part of a press release entitled, “Why This Martian Full Moon Looks Like Candy.” Geez, what a great question, let me think a minute…

Maybe because you color-coded it to look “like a rainbow-colored jawbreaker” (to quote the press release)? It’s not as if Phobos is actually radiating the ugly rainbow color palette! It was a choice—likely on the part of an ill-informed scientist who created the image and certainly on the part of a lazy press officer who decided to roll with it and compose an insipid headline rather than trying to create an intelligible message for public audiences.

(Sigh. Deep breath…)

To their credit, they at least released a captioned image, too, with accompanying color bar and added information.

And I will note that, what with our possibly intuitive mapping of red to hot and blue to cold—reinforced by water taps and weather maps having long employed red and blue for temperature—there are worse applications of the rainbow palette (for anything other than temperature, basically).

Once upon a time, I wrote thoughtful, nuanced posts for this blog. Now I’m just railing about ending the rainbow! But desperate times call for desperate measures, I suppose, so I’ll just mention that there’s oodles of research out there that demonstrates how the rainbow color palette works against our natural visual perception—an open letter to the climate science community outlines the most egregious issues. I’ll put some more on my resources page soon. “End of the rainbow” even has its own hastag on Twitter!

My real issue with this, at the end of the day, is not even so much the poor (a.k.a. default) choice of color palette as the choice of how to reify the choice by suggesting that the moon of Mars actually looks like candy.

All I can say is, NASA, please don’t give us candy! Give us something nutritious instead.

And maybe next time, I can write about something more substantive, too.

Preaching to the Choir

A press release from the Southwest Research Institute describes observations made of Jupiter’s magnetosphere by the New Horizons spacecraft. The above image (sorry, it’s quite low-res, and to take a closer look, you’ll need to open up the huge version linked from the above) summarizes some of the results. To summarize my response: it would work quite well in a scientific publication, but it just doesn’t cut it for public use.

I admit that it’s nice to see actual data represented—and nice to see an attempt at providing context for them—but the context in which the data fails to help much; furthermore, it really only conveys the context for an expert viewer—one who knows about the solar wind, magnetic fields, and such. In a previous post, I complained about depictions of Earth’s magnetosphere; I won’t bother reiterating my gripes, but they can be applied to the top portion of the above image. Honestly, some version of the schematic portion of the image would probably have sufficed for a press release, but it would have required significant work to be made more comprehensible.

Also, we’re given no hint as to how to read the spectrograms below the schematic diagram, and furthermore, they utilize opaque units such as “Energy/Q [eV/q]” and “DOY 2007 [UT].” Oh, yeah, and pseudocolor. ’Nuff said.

Making matters worse, the picture’s caption incorporates a trult impressive quantity of jargon. To call it “incomprehensible,” at least for public audiences, would be kind. The press release is better, but not by much. The only audience I can imagine picking up on this story is a quite sophistication publication such as Scientific American. I guess that’s all well and good (better than nothing), but a little more effort could make this result more accessible to broader audiences.

(I’ll just add that the New Horizons folks actually produced a spiffy press kit that describes the fly-by, with some decent diagrams, too.)

BTW, I’m in Athens attending the Communicating Astronomy with the Public conference. Fun stuff! And I finally achieved my goal of presenting a PowerPoint using no bullet point slides. A personal victory.

More Abstraction

Okay, I give up.

No, not with the blog, in spite of my lousy track record posting lately. I give up trying to figure out the image above…

I mean, it’s pretty and all, but what does it mean? I’m so baffled that I won’t even complain about the pseudocolor (indeed, I’m quite fond of orange). I read through the press release and the accompanying caption (which seems to have been removed recently), but… Huh?

Here’s the caption, BTW: “Spectroscopic image showing the microwave-frequency magnetic resonances of an array of parallel, metallic thin film nanowires (‘stripes’). The peak in the center is due to resonances occurring at the stripe edges while the strong horizontal bar is due to resonances in the body of the stripes.”

Since I’m trained in astronomy, my tendency is to read frequency along the horizontal axis, which would imply a peak of some sort at a particular frequency, but that doesn’t feel right, somehow. Maybe it’s actually a spectrogram of some sort, with the horizontal axis representing the spatial extent of the nanowires?

Whatever the image tries to show, the real question is: why confuse people with it?

The NSF Nose Best

It’s that time of year again! The National Science Foundation has announced the winners of the 2007 Science and Engineering Visualization Challenge.

What I find clever about the image above is exactly what is remarked upon in the caption from Science magazine’s Ben Lester. “Normally, CT renderings meld slices together into smooth surfaces, but, in what he terms the ‘Rainbow Technique,’ Fung instead broke them apart, creating a topographical map of the airspaces described by the contour lines of individual slices, and colored according to the density of the tissues that border them.”

I question whether that’s a completely accurate description of the technique: the contour-like color variation suggests that there’s more than tissue density informing the color selection. Regardless, the technique draws attention to the asymmetries in the image, which would be far less apparent if the same data were rendered in a photorealistic fashion. As always, I wonder how the uninitiated interpret images such as this, but overall, I rather like it. Even the Moiré patterns I manage to find both engaging and distracting at the same time.

(A much less appealing—in fact, presumably inadvertant—appearance of contours shows up in an image associated with an ESO press release that came out today. I would recommend a Gaussian blur, kiddos!)

Anyway, take a look at the other winners. Interesting stuff. You can check them out via the link above or by going to the corresponding page on the Science magazine site.

One short year ago, I blogged about a 2006 winner (while I was visiting Chicago and listening to Wolf Parade, evidently), which also happened to be a CT scan. And that reminds me! This blog is just a little over a year old. Sadly, I’ve been unable to pay as much attention to it of late, but so it goes. I won’t give up just yet (although I will cringe when people make reference to it at conferences or before I give a talk, since I’m embarrassed at how rarely I post nowadays).

Poor Label Placement

Image taken from an ESO press release about targeting dim objects near bright ones.

I was going to make just one snarky comment: namely, that one should be cautious where one places text in a contour plot… Or else one ends up with a small, circled “A” that misleadingly suggests the wrong location for an object.

Then I looked at the image and asked myself why the heck the contour lines were there at all (except to add visual confusion). As far as I can tell, they simply represent the same data shown by the pseudocolor image underneath. In other words, we’re being redundant on top of placing text poorly and haphazardly on the image.

Why do people insist on the entire freakin’ rainbow for their pseudocolor images? Is it because they’re trying to use up ink in their printer cartridges at an even rate? Is it because they can’t walk to their nearest public library and pick up an Edward Tufte book that will help set them straight?

Sigh. It’s been a long day. Time to go to another meeting…