
It’s that time of year again! The National Science Foundation has announced the winners of the 2007 Science and Engineering Visualization Challenge.
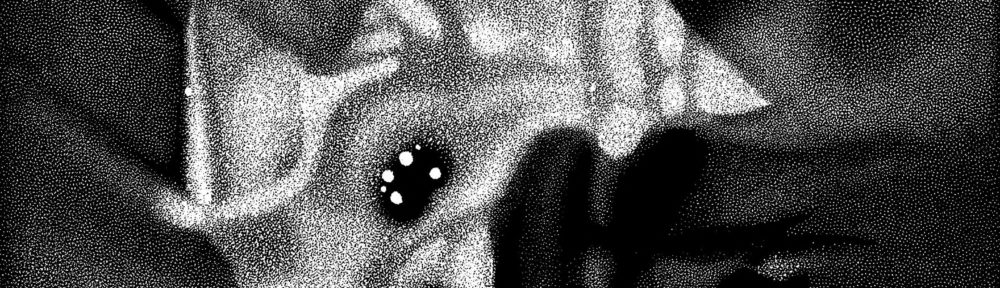
What I find clever about the image above is exactly what is remarked upon in the caption from Science magazine’s Ben Lester. “Normally, CT renderings meld slices together into smooth surfaces, but, in what he terms the ‘Rainbow Technique,’ Fung instead broke them apart, creating a topographical map of the airspaces described by the contour lines of individual slices, and colored according to the density of the tissues that border them.”
I question whether that’s a completely accurate description of the technique: the contour-like color variation suggests that there’s more than tissue density informing the color selection. Regardless, the technique draws attention to the asymmetries in the image, which would be far less apparent if the same data were rendered in a photorealistic fashion. As always, I wonder how the uninitiated interpret images such as this, but overall, I rather like it. Even the Moiré patterns I manage to find both engaging and distracting at the same time.
(A much less appealing—in fact, presumably inadvertant—appearance of contours shows up in an image associated with an ESO press release that came out today. I would recommend a Gaussian blur, kiddos!)
Anyway, take a look at the other winners. Interesting stuff. You can check them out via the link above or by going to the corresponding page on the Science magazine site.
One short year ago, I blogged about a 2006 winner (while I was visiting Chicago and listening to Wolf Parade, evidently), which also happened to be a CT scan. And that reminds me! This blog is just a little over a year old. Sadly, I’ve been unable to pay as much attention to it of late, but so it goes. I won’t give up just yet (although I will cringe when people make reference to it at conferences or before I give a talk, since I’m embarrassed at how rarely I post nowadays).
