Ionosphere in 4D

Space Environment Technologies’ Communication Alert and Prediction System has announced Earth Space 4-D, a collection of layers in Google Earth.

Unfortunately, the ES4D site offers basically no information about the layers themselves. For that, you need to go to the press release from which I learned about the whole thing: “ ‘Colors represent electron content,’ Tobiska explains. “Bright red is high density; that’s where radio communications are restricted to few or no frequencies. Blue is low density; no problem there.’ ” Okay, not bad, but why can’t we link to come kind of explanatory text on the page that serves up the data layers?

Another gripe. The ionosphere extends up to about 200 kilometers, but the KML layer seems to hover above that. It just seems like you could represent the electron density and such at its actual altitude.

And another. Unfortunately, you evidently need to download new KML files from the aforementioned site every time you want to take a look at the data. Hrm. Less than elegant. Isn’t there a way to offer KML layer that update automatically…?

So, I dunno. I guess this is a good start, but I think the offering could make better use of the available tools and technologies, the data should be represented to scale, and for heaven’s sake, we should be told what we’re looking at.

Seeing Red

A personal post today… I’m color blind, and admitting to that often results in people asking how a color blind person can be a “science visualizer” or (as is the case now) a “director of science visualization.” My reply usually has to do with experiencing the subjectivity of seeing early on and blah, blah, blah. I won’t subject you to that right now.

Instead I simply want to quote a couple of sentences from an interview with Arno Motulsky that appears in today’s Science Times: “Our laboratory found that one-half of males with normal color vision had the amino acid alanine in their red pigment, while the other half all carried the amino acid serine, at the same site. This finding means that the same exact red color is perceived as a different type of red, depending on a person’s genetic makeup.”

Ha! So there, you “color seeing” people! You “normal color vision” types! You don’t see an absolute “red” any more than I do.

(Thanks, BTW, to Declan McCullagh, who doesn’t know I cribbed his image above. I need to write and ask him for permission…)

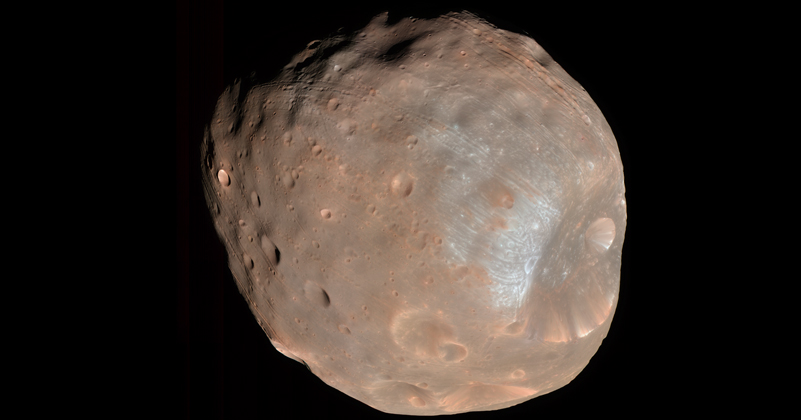
Phobos in Stereo

Sometimes I just want to post a kewl image, and this qualifies! The above image of Mars’s moon Phobos stopped me in my tracks this morning, for a multitude of reasons’

First off, it’s color. I don’t recall any earlier color images of Phobos, although I’m too lazy to go check.

Secondly, it’s available in stereo! Which is to say, stereoscopic, not stereophonic. What the rest of the world calls “3D.” This happens to be on my mind, since I’m involved with this crazy construction project, which will eventually house a gorgeous planetarium (of course) as well as a stereoscopic theater. I’m keenly interested in finding content for it, particularly real-world content that isn’t computer-generated. (If you want to watch a video of me from the recent CineGrid conference, you can learn more about my vision for media in the new California Academy of Sciences.)

But lastly, I was especially surprised because the image was taken by the HiRISE camera aboard NASA’s Mars Reconnaissance Orbiter (MRO). HiRISE has taken all kinds of spiffy images of the surface of Mars, but I can only attribute it to a lack of imagination on my part that HiRISE snapping a picture of one of Mars’s moons never occurred to me.

Visualizing Subjectivity

An article in today’s Science Times describes the artwork of Anne Adams, who suffered from frontotemporal dementia (FTD), which effectively rewires the brain in a way that can produce compulsive behaviors ranging from shoplifting to increased creativity. Adams, as you may guess, exhibited signs of the latter, increasing her output (and some might say her innovativeness) as an artist.

Some of her drawings and paintings appear on a web page from the UCSF Medical Center (“UCSF” refers to the University of California, San Francisco, BTW, so this is a shout out to my new homies) as part of the Patient Art Gallery of their Memory and Aging Center. The title of the above image is “Migrane,” which got me to thinking…

While it might be a little overblown to equate Adams’s drawings with a totally different condition, I nonetheless immediately thought of the effects of Charles Bonnet syndrome, when a person’s increasing blindness can occasionally result in vivid hallucinations—resulting from brain stimuli “bleeding over” into the visual cortex, if I can be forgiven for such a slapdash description.

I first read about Charles Bonnet syndrome in V S Ramachandran’s brilliant Phantoms in the Brain, which has much to recommend it if you’re at all interested in brain physiology—hateful as it is to think of one’s grey matter as, well, matter. As I recall, Ramachandran suggests that some of James Thurber’s later drawings may have been partly inspired by the hallucinations he experienced. Of course, I read the book about nine years ago (and it currently sits, unpacked and unavailable for review, in a box until I get my new office), so my recollection may have suffered.

The folks at Damn Interesting had a damn interesting entry about the syndrome earlier this year.

At any rate, I often like to talk about the subjectivity of science visualization, but these examples take subjectivity to the ultimate level: the completely subjective experience of an individual’s brain state.

(Oh, and happy birthday, Mom!)