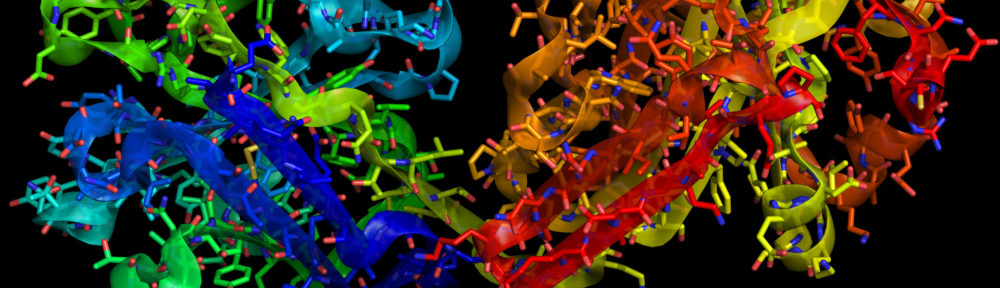

The above image comes from Stephen Wolfram’s blog announcing proof of the simplest universal Turing machine. Believe me, I’m not about to describe a Turing machine, but I will happily describe my utter confusion when seeing the image. It initially reminded me of a Sierpinski Triangle, but obviously, something else is going on, and there’s no explanation to help! In my typical, touchy way, I got annoyed at this silly little picture, lacking any caption or descriptive text, presented as some kind of straightforward statement of the problem and its solution. Grrr…
Then I started trying to figure it out. I’ve previously blogged about the Mathematica Player and Wolfram Demonstration Project, and indeed, there’s a similar (actually, mathematically identical) example of a Turing machine in the collection. That discovery clarifies things somewhat, and yet another actually makes it quite comprehensible. In fact, reading the “New Kind of Science” prize from Wolfram’s blog, it became obvious to me that Wolfram (at least, maybe others, for all I know) has a visual shorthand that he uses in describing Turing machines—and that Mathematica evidently uses in displaying them. And I then realized that I had gotten in a huff a little hastily.
Allow me to extol a bit of personal pedagogy. In general (as I’ve mentioned in my “What Is Viz?” presentation), I divide science visualization into three basic types: 1) communication with oneself, 2) communication with a peer group, and 3) communication with public audiences. In typical astronomer parlance, I will refer to these as Type 1, Type 2, and Type 3 visualizations. In this blog, I most often comment on Type 3 visualizations (those addressed to a broad audience), and I initially mistook the above image for that type.
But it’s not. Instead, I think Wolfram has devised a Type 1 visualization of the Turing machine that, thanks to Wolfram’s influence, has transitioned to a Type 2. Presumably, there’s some small audience of “peers” out there for whom the above makes plenty of sense—perhaps they can even extract useful information from it.
