
I ran across an image similar to the above on page 86 of Philip Ball’s marvelous little The Elements: A Very Short Introduction, part of an impressive series from Oxford University Press. (I highly recommend these wee volumes, which offer a lot of bang for the buck, at least in the limited selection of titles I’ve perused.)
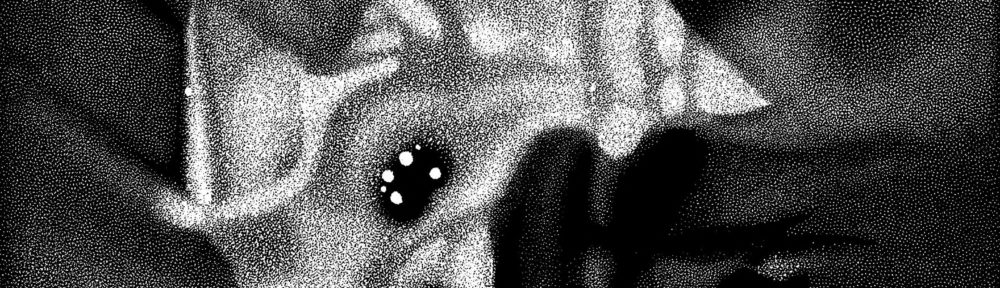
Anyway, the image. It shows the “lemniscate spiral” of a certain William Crookes (not exactly a household name, but an interesting fellow nonetheless). I have previously blogged about the periodic table, but I find this attempt particularly intriguing. Crookes was trying to visualize the relationship between various elements in three dimensions, which is the kind of thing we do without thinking nowadays, but in the late 19th Century… Of course you’d have to try constructing a convoluted contraption to convey your idea!
That’s what I find interesting about the image: a 19th-century scientist would use an image depicting the hypothetical three-dimensional object in physical terms. Because the abstraction of three dimensions could not (easily) be conveyed pictorally without reliance on real-world elements to suggest the construct extending outside the plane of the printed page. Honestly, I have no idea whether Crookes physically constructed his “lemniscate spiral” or not, but I’m guessing not. Which is what makes me think this the image is a way of communicating the idea.
Whereas modern tools allow us to visualize data in three dimensions and, at some level, conceive of things in three dimensions, such virtual luxuries were unavailable to Crookes and his contemporaries. Thus the conceit of the physical object.
Interestingly, I know of no modern three-dimensional visualizations of the periodic table. Perhaps someone can point me to something…? But if they exist, I bet they aren’t depicted as physical objects.
