
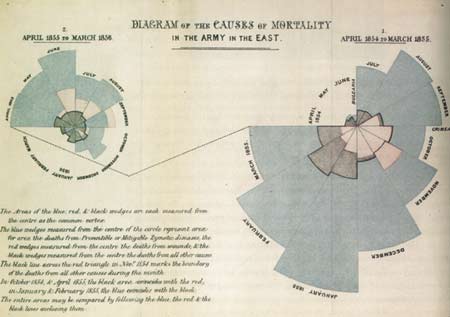
I just finished reading Chances Are… by Michael Kaplan and Ellen Kaplan, which made reference to Florence Nightingale’s statistical diagrams, one of which I reproduce above.
One might think of Florence Nightingale as some kind of übernurse, but she also made significant contributions to the understanding of infectious diseases—and importantly, a statistical approach to understanding disease. In the diagram above, time progresses clockwise around the polar plot, from April 1854 to March 1855; the bluish-green area represents the deaths from “Preventable or Mitigable Zymotic diseases,” the pinkish-red area the deaths from wounds, and the greyish-black area deaths from all other causes.
Honestly, the diagram has become noteworthy for its uniqueness. People didn’t actually rush out and begin producing pie-like charts of this ilk, but some designers have looked upon Nightingale’s graphics with some admiration, and indeed, the fact that she chose to represent the information graphically says quite a bit.
Interestingly, I had just run across Nightingale’s work in I. Bernard Cohen’s final book, The Triumph of Numbers: How Counting Shaped Modern Life. A pithier, slimmer, and more colorful exercise than the aforementioned volume, albeit one left unfinished at the time of his death.
In general, the Kaplans’ book promises a bit more than it manages to deliver, but it’s a thoughtful discussion on the topic of probability and its intersection with science, thought, and everyday life. They manage to make connections to topics as varied as law, insurance, and global warming, while bringing in the work of mathematicians as varied as Pascal and Kolmogorov, Quetelet and Bjerknes. My greatest complaint? A lack of footnotes, appendices, and references: the complex and often obscure topics could benefit from each and every one.
As a final note, I’ll mention, too, that the image above comes from a “timeline of timelines” that I found in Cabinet magazine online. Interesting stuff…