A Grain of Sociology

Today’s “Blog around the Clock” links to a Flash visualization of the spread of world religions over the lat 5,000 years. On a slow science day (coinciding with the day before a major religious holiday), it seemed reasonable to draw attention to this viz. As the Maps of War site says, “See 5,000 years of religion in 90 seconds…” The snapshot above simply shows the last frame of the animation.

Interesting. Of course, any visualization of sociological data should be taken with a grain of salt, but the graphics are ultimately quite comprehensible and clear. Good color-coding, good keying, good idea. Now if they could just add little flashes when battles erupted, along with a tally of the number of people who died in the name of their respective religions, I’d be a real fan of the site.

(As an aside, I just checked, having used the phrase “grain of salt,” and apparently, its origins remain ambiguous. Hmmm.)

Overdramatizing

The above image comes from ESA’s website for the COROT (which supposedly stands for “COnvection ROtation and planetary Transits) mission, which will look for potentially terrestrial-sized planets orbiting other stars as well as “starquakes” as small as a few meters. The mission is scheduled to launch into orbit this week.

Without going into any details about the astronomy, I would like to rage, rage against the dying of the science in illustrations such as this. I understand what the artist is attempting to do in the image—the shadowed planet on the right is a rocky world orbiting the blindingly bright star in the middle, exactly the kind of planetary system that COROT (shown shockingly close to the system in near foreground) might be able to find. But the artistic license in the image presents such a Star Trek-ized version of the cosmos that I fear it does more harm than good. People are confused enough about the scale of the Universe, must we muddy the celestial waters with imagery that values drama over content?

I don’t have a solution for the conundrum. I understand the need for creating compelling imagery, but when we distance ourselves from what we can truly provide—namely, an understanding of scientific processes and results—we undercut its true significance. Art is great; I love art and occasionally attempt to create it. But I honestly think we hurt ourselves with images such as the one above.

(In case you’re curious about COROT, you can check out the ESA site, or take a look at a Nature article that describes the mission and the impending lift-off.)

Breathing Earth

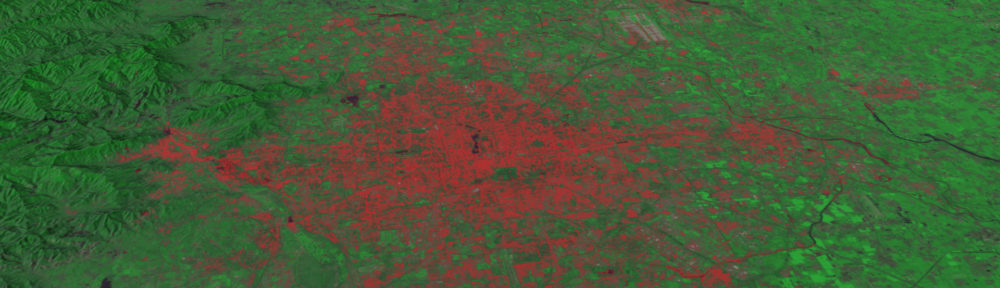
A frequent reader of this blog just pointed me to the “Breathing Earth” website, from which I took the snapshot pasted above. The site takes data about countries’ birth and death rates as well as carbon dioxide emissions and incorporates them into a single, interactive map of the world. Births and deaths show up as flashes on the world map, while the color of a country represents its carbon dioxide emissions.

What the snapshot above doesn’t show is the interactive bit of the site, which allows you to mouse over a country to learn about its particular birth and death rate as well as its carbon dioxide emissions. Plus, it features a running tally in the lower left-hand corner that shows how many people have been born, how many died, and how much carbon dioxide has been emitted since you personally opened the web page.

Overall, this strikes me as a spiffy visualization, and my initial inclination is to see more data represented—perhaps not all at the same time, since I would hate to see the pleasant design marred by overcrowding, but maybe as options. In other words, it seems like a good template. One of the challenges of presenting only a few data elements is that it suggests a causal connection between them, whereas having a more generous set of options would allow the user to explore more on her own. In terms of the content actually presented, I’m a little confused by what the color of the country really means, since the caption reads variously “country has emitted over/less than 1000 tonnes of CO2” and “is currently emitting more than 1000 tonnes of CO2.” The last statement is meaningless, since “currently” would require some rate of emission, not simply a quantity. So it seems that it could use a little more detail in the captioning.

(Then, on an utterly nitpicky note, the regular gridlines of the above image suggest a Mercator projection, but the layout of the geography looks more like the traditional Robinson projection. That annoys me, but I’m easily annoyed that way. For more on map projections, BTW, you can take a look at the “Geographer’s Craft” page or the more detailed but less complete page at USGS. For the truly anal-retentive, check out Hans Havlicek’s page for more information than most of us ever need on the topic.)

I actually took a very different approach to visualizing socio-economic data in an “art” piece I created as an interactive and for fulldome video. I dropped the map and put elements into a very abstract space, hoping to see patterns that could work on both an aesthetic and an intellectual level. Dunno if I succeeded, but I entitled it “Numerology 0.1,” if that gives any sense of how I feel about it.

Visualizing Dark Matter

So I’d just finished writing my previous post, and lo and behold, a press release from Hawaii arrives in my email inbox. The image above shows gravitational lensing in a group of galaxies—which is to say, not a cluster of galaxies but a structure much smaller and less massive. This is the first time lensing has been observed resulting from such low-mass collections of galaxies.

Coincidentally, the discovery of the first gravitational lens was published exactly twenty years previous—in January 1987—also by the Canada-France-Hawaii Telescope (CFHT). The original image can be found on the page of images that accompanies the new announcement.

The image lacks much meaning for the uninitiated, although an accompanying image that shows how lensing works can clarify the concept greatly. (Unfortunately, those vary widely in quality and ability to induce or reduce confusion, but that’s a subject for a lengthier post.) Even better, you can connect research images with, say, an animation (with appropriate descriptive elements) that shows lensing, along the lines of one available on the Wikipedia site.

As an aside, I should mention that the light gets bent more by dark matter than the luminous matter in the galaxies. So in a sense, gravitational lenses allow us to visualize dark matter… (That’s my excuse for the subject of this post.)

Colliding Lasers

A EurekAlert about lasers mimicking the properties of superfluids uses the above image to illustrate its message. The caption reads, simply enough, “Princeton University researchers used lasers to model colliding shock waves in superfluids.” And somehow, the image communicates enough (not much, but enough) to make me appreciate that, get the punchline, and move on. I get the idea that the image was made using lasers, and it looks like something is colliding, so… Okay, I’m with you.

Or maybe it’s just the colors. I like the colors.

Doctor Octopus

As the holidays approach, my comments get more insipid. But I saw the image above as part of a Johns Hopkins press release about using a “snake-like robot” for minute medical procedures. Perhaps this is just a continuation of the previously-referenced “tactilizing” work, but I was rather charmed by the picture.

Of course, I am a bit of a comic-book freak. And even though Spider-Man was never a favorite, the association with Doc Ock at least enhances the kewlness factor.

What the heck are the little colored things it’s picking up, though?

Zoom in the New Year

The Hubble Space Telescope released the image above as part of a “Celestial Season’s Greetings” release. Nice enough picture, and although I’m unclear on the seasonal part, I find it interesting that Hubble site has joined in the zoomify style of presenting images.

I ran across “The Big Picture” site at Caltech this week as well, although I think it’s been around for a while.

An interesting, new, albeit content-less way of interacting with the imagery.

CG Takes Flight

A press release from Brown University describes the evolution of structures required for flight. Turns out that a specific ligament (labeled “AHL” in the above image) provides stabilization to maintain a gliding posture in pigeons—computer modeling permitted the calculation of the necessary forces and also resulted in a pretty spiffy image to illustrate the findings. It actually took me a moment to see the symmetry in the image, but as soon as I “read” the pigeon’s beak pointing to the right, it snapped into place. Nice work.

The caption for the above reads, entertainingly enough, “Using computer modeling, treadmills and the fossil record, researchers have shown that the acrocoracohumeral ligament (AHL), a short band of tissue that connects the humerus to the shoulder joint in birds, was a critical element in the evolution of flight.” The treadmills, BTW, came into play when alligators (close but obviously flightless relatives of the birds) were x-rayed while walking; researchers found that muscles, not ligaments, supported the shoulder. The fossil record seems to indicate that the ligament structures evolved gradually.

Also, it’s worth noting that the image is credited to the researcher himself, David Baier, who seems to have recently gotten his Ph.D. It’s great to see imagery coming directly from the person doing the work. The Brown University Ecology & Evolutionary Biology Newsletter from May 2004 describes some related work and makes mention of Baier.

Fungi Card Catalog

The image above accompanies a press release from Berkeley about research being done with a vast collection of fungi. Matteo Garbelotto (the fellow in the picture) is sifting through 28,000 samples housed at the Venice Museum of Natural History to create a database of fungal DNA.

I have previously belittled the use of scientist-at-work images, but I quite like this one, in large part because it represents an aspect of the scientific endeavor that doesn’t occur to most people. The sheer scope of this kind of collections-based research is familiar around the halls of my home institution, but I don’t think it occurs to the majority of people how much drudgery goes into a lot of research. And how, sometimes, you just have to flip through things the good old-fashioned way.

That said, it would have been nice to complement the images with a high-tech DNA something-or-other, just to illustrate the contrast between 19th-century card catalogs of fungi and 21st-century methods of analysis.

I also have to note, admitting my typical ignorance of most science biological, that I had no idea of the role played by fungi until I read Michael Pollan’s brilliant Omnivore’s Dilemma. As the Wikipedia article on fungi notes, “Fungi often have important symbiotic relationships with other organisms. Mycorrhizal symbiosis between plants and fungi is particularly important; over 90% of all plant species engage in some kind of mycorrhizal relationship with fungi and are dependent upon this relationship for survival.” Holy toadstool, Batman!

Radar on Mars

The above image comes from an ESA press release about radar imaging of subsurface structures on Mars. Basically, the top two “radargrams” somehow map onto the (very colorful) martian surface images below. On the one hand, I can understand why the writers of the press release might be loath to go into detail about the technique employed in going from the top image to the bottom, but I also wonder what people think when they see images like the rainbow-colored pair.

I mean, I look at the superimposed dark radar image and the superimposed dotted white lines—and they don’t even seem to coincide! The image doesn’t support the message.

In a case such as this, it strikes me as potentially helpful to show an image of a simplified situation. Show me the geometry of a crater, perhaps as a cutaway, then show me what an idealized radargram of that would look like. Put in context with actual data, such a cartoon often clarifies an otherwise confusing situation.