Dark Matter Observed…
In Visualizations

A new press release from the European Southern Observatory (ESO) announces a lack of observational evidence for dark matter nearby: “New measurements show that the amount of dark matter in a large region around the Sun is far smaller than predicted and have indicated that there is no significant dark matter at all in our neighbourhood.”

Pretty significant stuff, but let’s take a look at the accompanying images…

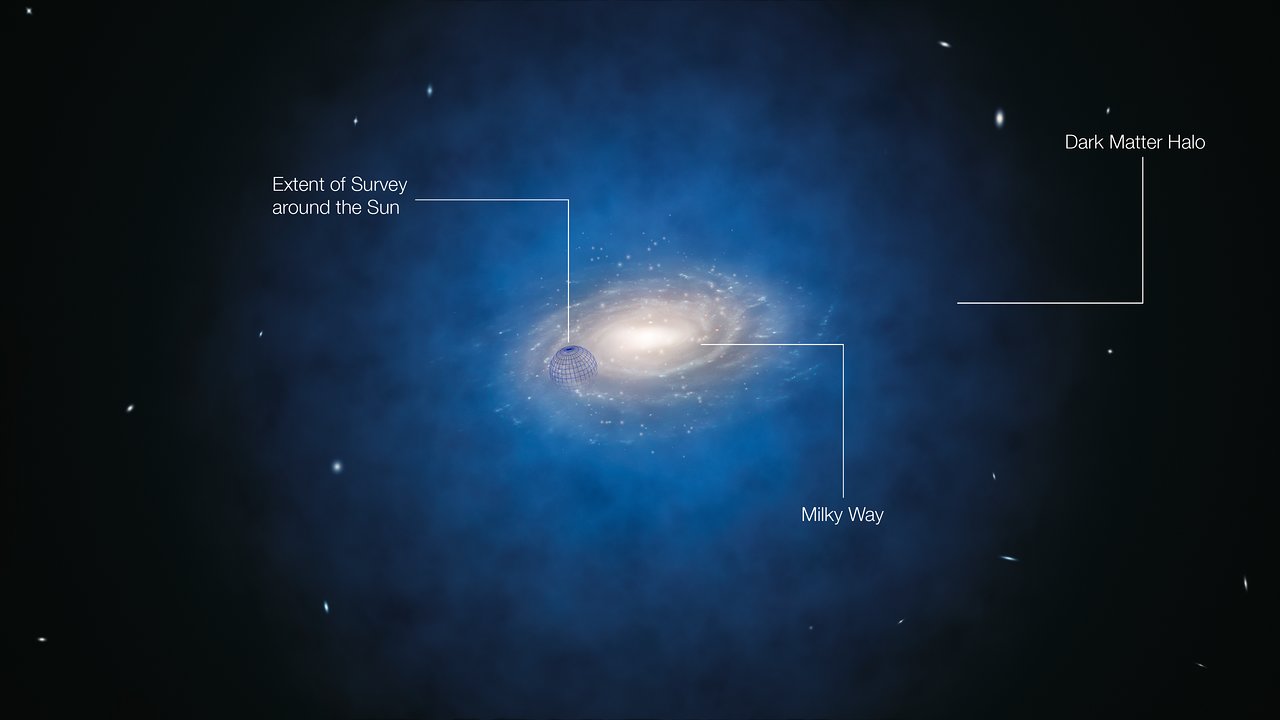
I admire their simplicity, but hey, with dark matter, what choice does a visualizer have? The depiction of the dark matter halo around the Milky Way looks a little clumpy to me, but again, what else can you do? A uniform blob of blue around a galaxy image doesn’t communicate much…

(Admittedly, at the scale of this image, simulations reveal the Milky Way’s dark matter environment to be somewhat clumpy, albeit not in the way depicted in the animation. It’d be keen to use computational data in a visualization such as this one, but I suppose limited time and resources prevent that.)

Anyway, I like the annotated version of the image above; in particular, the indication of the volume of space relevant to the survey.

The accompanying video (available in ESO’s typical plethora of formats) is also an exercise in simplicity, offering a straightforward revolution around the three-dimensional model used to produce the still above. I kinda wish they included the sphere around the Sun once again, just to convey the scale of the survey, but I can guess why they avoided it… Then you have to think about labels, and labels mean language, and it is the European Southern Observatory, after all. Gotta make good b-roll for Hungarian nightly news, I suppose.

And on a final note, not that I would ever nitpick, but… Are those actual galaxy locations in the background? I’ve flown around the Local Group quite a bit, and although adjusting the brightness of the nearby galaxies can change the appearance considerably, I don’t recognize anything in the background. Just curious.

Nice work from ESO, understated but effective. And maybe someday, these kind of press images can be more data-driven.

Biochemical Art

I’m attending the Gordon Conference on Visualization in Science and Education, and this morning, we had a chance to hear (and see) David Goodsell from the Scripps Institute. Goodsell complements his research work with significant and influential dabbling in artwork. Above, you can see an image of blood serum taken from a collection of images he created for Biosite. His website describes the image as follows:

“Blood serum is shown in the picture, with many Y-shaped antibodies, large circular low density lipoproteins, and lots of small albumin molecules. The large fibrous structure at lower left is von Willebrand factor and the long molecules in red are fibrinogen, both of which are involved in blood clotting. The blue object is poliovirus.”

Goodsell preserves the shapes and relative sizes of the molecules while flattening the typical three-dimensional representations of molecules. He also represents the structures in cross section, using orthographic rendering to allow depicting large areas (large, that is, relative to the size of the molecules).

All of Goodsell’s images make good use of color, and I find the above image a particularly striking example. The poliovirus sticks out like a sore thumb (attractively composed asymmetrically within the frame), as of course it should. And it’s exceedingly pleasant to see depictions of molecules freed from the garish pseudocolor rainbow that seems to dominate the medium. Goodsell’s galleries include many more examples…

Evidently, Goodsell is also responsible for the “Molecule of the Month” at the RCSB Protein Data Bank (PDB). I haven’t taken a close look yet, but I plan to!

BTW, my home institution just started including me in a new category for the “Science in Action” podcast. Take a listen! I’ll have two more podcasts this week, mostly talking about the conference.

Prehistoric Penguins

Now that I work at an institution that features penguins rather prominently, I find myself paying more attention to our tuxedoed friends. So it was hard to miss the Reuters story while I was browsing this morning.

According to the caption: “The late Eocene giant penguin Icadyptes salasi (right) and the middle Eocene Perudyptes devriesi (left) are shown to scale with the only extant penguin inhabiting Peru, Spheniscus humbolti (center).”

Even at this meager resolution, the illustration charms me with its depiction of the two smaller penguins gazing somewhat curiously at their larger relative—and the late Eocene fellow apparently opening his beak in amusement or mock surprise at his diminutive kin. I’m reading into it, obviously, but the illustration allows for a very friendly experience of information about the size and appearance of the animals.

Now, as Stephen Asma points out in his brilliant book, Stuffed Animals and Pickled Heads: The Culture and Evolution of Natural History Museums, the arrangement of specimens in a museum diorama can suggest misleading family groupings and social relationships and so forth. With the three species illustrated above, however, we’re seeing creatures from very different epochs placed side-by-side purely for purposes of comparison. To that end, the character and anthropomorphization of the subjects seems to me an added benefit.

I mean, it’s not exactly Cubee the Aggregate™, but hey…

So, kudos to artist Kristin Lamm. Nice work!

Visualizing on the Radio

Today’s Leonard Lopate “Please Explain” focused on scientific visualization. (The image above is just a sample from an accompanying slideshow, heavily biased as it is toward medical visualizations. I happen to like it more than some of the others, but more on it later.) Lopate had two guests: Graham Johnson, a certified medical illustrator, and Felice Frankel, to whom I’ve referred previously and who started the Image and Meaning conference that’s come up previously as well.

My favorite exchange…

Lopate: “The image stay with us the rest of our life until somebody tells us that’s no longer true.”

Frankel: “And you know what? Even if they tell you it’s no longer true, that doesn’t matter…’

Exactly! Images are extremely powerful, and they become stand-ins for concepts. When an image truly settles into our brain and we know what information we can and cannot extract from it, it acts as a useful stand-in for concepts and ideas. Misinterpreted, however, or trusted too much, an image can become very misleading. Of course, reality can be misleading, too, which is why medical illustrators have kept their jobs even in the age of photography. As Johnson explained, “Our job is to pull out pertinent information and subdue the ancillary information so that we can tell a story—a particular story.” Well put.

So if you get a chance, download the MP3 and take a listen.

The above image has a great caption, BTW, in terms of presenting it in context… “Membrane Structure and Function: Used as a section overview, this figure summarizes the content of five chapters that describe the anatomy and physiology of lipid bilayers and their resident proteins. Here, the ‘water fearing’ chains of a lipid bilayer separate the cytoplasm of a cell (beige background-bottom) from the outside world (light blue background-top).”

With that explanation, I feel confident in liking the illustration even more. I even want to read the chapters!

Just as an aside, Lopate also made reference to the newly-opened Anne and Bernard Spitzer Hall of Human Origins at the American Museum of Natural History. He mentioned the design of the dioramas in the hall, the attention to detail and attempt to achieve realism. Nice to hear, since my coworker Carter and I tend to see our work on the Museum’s space shows as continuing that fine tradition. It really is a form of science visualization. (And if you’re interested in learning more about the painstaking efforts to create realistic nature dioramas, take a look at Stephen Quinn’s Windows on Nature, which came out less than a year ago. Brilliant stuff.)

Hmmm. I’ve been accused of being too upbeat this week, for which I apologize. I’ll try to find something to gripe about in the next day or so. Until then…

Pencil versus CAD

A Monday-afternoon lamentation on seeing ESO’s press release on the European Extremely Large Telescope. I noticed the above computer-generated rendering of the telescope, and I reflected back on my recent trip to Pasadena, where my coworkers and I wandered along the corridors of the Caltech astronomy department admiring the drawings of Russell W. Porter, who created remarkable illustrations of many of the telescopes at Mount Palomar.

Caltech’s archives offer mediocre reproductions of Porter’s work, but Bruce Weertman has assembled a much more impressive page of the drawings. Nothing compares to seeing the originals, however, and although I have heard tell of a book collecting his work, my (admittedly cursory) searches haven’t revealed anything definitive.

Looking at the above image, the little tiny figures on the lower half of the (oddly shiny) disk show two people and a pick-up truck to scale with the rest of the telescope. Extremely large indeed! Porter provides a similar sense of scale in virtually all of his drawings (an overview of the 200-inch telescope at Mt. Palomar, for example), and many of his illustrations also show the path light follows through the telescope in addition to mechanical deatils such as gears and supports. He packed a lot into his work.

According to an article on Kevin Hulsey’s website, “famed artist Maxfield Parrish was quoted as saying the following about Porter’s drawings: ‘If these drawings had been made from the telescope and its machinery after it had been erected they would have been of exceptional excellence, giving an uncanny sense of reality, with shadows accurately cast and well nigh perfect perspective; but to think that any artist had his pictorial imagination in such working order as to construct these pictures with no other mechanical data than blue prints of plans and elevation of the various intricate forms is simply beyond belief.’ ”

Long before CAD programs made the job easy (or at least easier), Porter sketched out spectacular visualizations of these phenomenal mid-century achievements. I wonder what we lose by working in an almost exclusively computer-generated realm nowadays. I’m not suggesting going back (necessarily), but… Just wondering.