Tools and Language

Seed Magazine’s Daily Zeitgeist pointed to this post on the Frontal Cortex blog, which is where I found the video I link to above.

Um, wow.

Visualizing another person’s mental state is basically impossible; one can only approach by suggestion and by analogy. And the eight-minute video above, created by an autistic woman, presents a deeply moving and profound glimpse into her world—a statement that is at once scientific, aesthetic, political, and passionate. I had read textbook descriptions of autism that I thought gave me a superficial understanding of the condition, but Amanda’s video transformed my thinking.

Furthermore, the use of (in fact, reliance upon) technology fascinates me. It provides the toolset that allows Amanda not just to create, but also to communicate, via everything from voice synthesis to widescale distribution online. It thrills me to think that we live in a time when such things can happen, when silenced people can speak, when otherwise unarticulated ideas can find expression.

Red, Hot, and Blue

A simple enough image today—the cover of the 2007 Edmund Optics catalog. I saw a post on the Cosmic Variance blog about this image and decided that, although it’s a bit of a stretch, this does in fact touch upon “visualizing science.” Sadly, in a way that reflects poorly on the state of gender parity within certain disciplines.

What’s truly disheartening about the image is that the people who published it seem completely oblivious to what it says. I yammer on about visual language all the time, typically in the context of scientific vocabularies that can obscure or distort intended meanings. But here’s visual language of a different sort—imagery with an unintended cultural meaning that also says something about science, or at least the cultural practice of science.

If you feel inclined to write to Edmund Optics about the cover (and I encourage you to do so), take a look at the aforementioned Cosmic Variance post, which includes email addresses and such.

Die Fledermaus

Today’s Science Times, under the heading “Science Illustrated” (which I’ve never noticed before), links to a large and luxurious graphic about bat flight. Would I be continuing too strongly in my positive trend from last week to pay my compliments right off the, um, bat?

This “visualizing science” stuff seems to be catching on. Or am I really just starting to pay attention? What with Leonard Lopate talking about sci viz on his radio program and a Gordon Conference devoted to “Visualization in Science and Education” coming up, it seems that the visual conveyance of scientific concepts is really catching on!

I think the New York Times graphic demonstrates how helpful a graphic designer can be in arranging and structuring a vast quantity of information in an aesthetically pleasing and memorable fashion. I looked at the webpage of Jose Iriarte-Diaz, which features links to both pictures and videos of the wee mammals in the wind tunnel (including the image above). Very well done for a researcher’s page! But take a look at that Times graphic. Edward Tufte would be proud.

(One thing that didn’t make it into the newspaper, however, were any photos of the adorable little critters! A loss, minor but not insignificant.)

A parting thought or two (or three)…

Buried deep in a Brown University press release on bat locomotion, I noticed the line, “The video images are impressive, but to truly understand how bats fly, the researchers needed to make the invisible visible.” Interestingly, this very concept comes up repeatedly in discussions about “visualizing science.” How does one communicate visually what one cannot actually see, particularly when so much contemporary scientific discovery relies on data beyond our immediate sensory perception?

And now, two random intersections with this topic of flight, simply to assert a bit of Jungian acausal parallelism. Seeing the bat pictures immediately reminded me of a sculpture I had just noticed at New Orleans’s Louis Armstrong Airport, evidently based on Leonardo da Vinci’s ornithopter, which of course had a bat wing as its partial inspiration. Furthermore, I just last night read a passage in Benjamin Woolley’s impressive biography of Ada Lovelace, Bride of Science, describing Lovelace’s adolescent fascination with flight. “Effect without a cause / Sub-atomic laws, scientific pause / Synchronicity…”

Nursing Old Wounds

I just finished reading Chances Are… by Michael Kaplan and Ellen Kaplan, which made reference to Florence Nightingale’s statistical diagrams, one of which I reproduce above.

One might think of Florence Nightingale as some kind of übernurse, but she also made significant contributions to the understanding of infectious diseases—and importantly, a statistical approach to understanding disease. In the diagram above, time progresses clockwise around the polar plot, from April 1854 to March 1855; the bluish-green area represents the deaths from “Preventable or Mitigable Zymotic diseases,” the pinkish-red area the deaths from wounds, and the greyish-black area deaths from all other causes.

Honestly, the diagram has become noteworthy for its uniqueness. People didn’t actually rush out and begin producing pie-like charts of this ilk, but some designers have looked upon Nightingale’s graphics with some admiration, and indeed, the fact that she chose to represent the information graphically says quite a bit.

Interestingly, I had just run across Nightingale’s work in I. Bernard Cohen’s final book, The Triumph of Numbers: How Counting Shaped Modern Life. A pithier, slimmer, and more colorful exercise than the aforementioned volume, albeit one left unfinished at the time of his death.

In general, the Kaplans’ book promises a bit more than it manages to deliver, but it’s a thoughtful discussion on the topic of probability and its intersection with science, thought, and everyday life. They manage to make connections to topics as varied as law, insurance, and global warming, while bringing in the work of mathematicians as varied as Pascal and Kolmogorov, Quetelet and Bjerknes. My greatest complaint? A lack of footnotes, appendices, and references: the complex and often obscure topics could benefit from each and every one.

As a final note, I’ll mention, too, that the image above comes from a “timeline of timelines” that I found in Cabinet magazine online. Interesting stuff…

Visualizing on the Radio

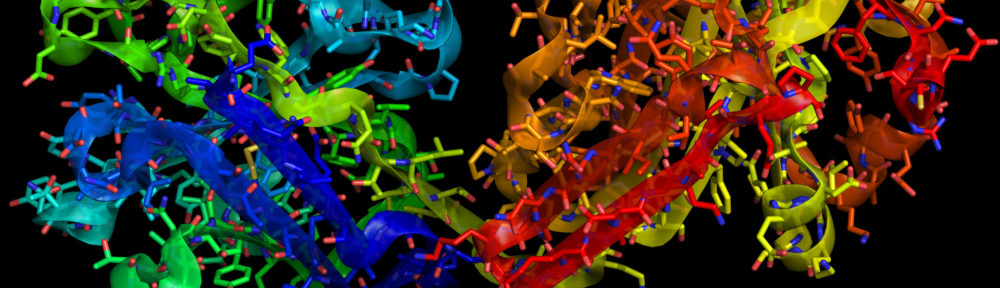
Today’s Leonard Lopate “Please Explain” focused on scientific visualization. (The image above is just a sample from an accompanying slideshow, heavily biased as it is toward medical visualizations. I happen to like it more than some of the others, but more on it later.) Lopate had two guests: Graham Johnson, a certified medical illustrator, and Felice Frankel, to whom I’ve referred previously and who started the Image and Meaning conference that’s come up previously as well.

My favorite exchange…

Lopate: “The image stay with us the rest of our life until somebody tells us that’s no longer true.”

Frankel: “And you know what? Even if they tell you it’s no longer true, that doesn’t matter…’

Exactly! Images are extremely powerful, and they become stand-ins for concepts. When an image truly settles into our brain and we know what information we can and cannot extract from it, it acts as a useful stand-in for concepts and ideas. Misinterpreted, however, or trusted too much, an image can become very misleading. Of course, reality can be misleading, too, which is why medical illustrators have kept their jobs even in the age of photography. As Johnson explained, “Our job is to pull out pertinent information and subdue the ancillary information so that we can tell a story—a particular story.” Well put.

So if you get a chance, download the MP3 and take a listen.

The above image has a great caption, BTW, in terms of presenting it in context… “Membrane Structure and Function: Used as a section overview, this figure summarizes the content of five chapters that describe the anatomy and physiology of lipid bilayers and their resident proteins. Here, the ‘water fearing’ chains of a lipid bilayer separate the cytoplasm of a cell (beige background-bottom) from the outside world (light blue background-top).”

With that explanation, I feel confident in liking the illustration even more. I even want to read the chapters!

Just as an aside, Lopate also made reference to the newly-opened Anne and Bernard Spitzer Hall of Human Origins at the American Museum of Natural History. He mentioned the design of the dioramas in the hall, the attention to detail and attempt to achieve realism. Nice to hear, since my coworker Carter and I tend to see our work on the Museum’s space shows as continuing that fine tradition. It really is a form of science visualization. (And if you’re interested in learning more about the painstaking efforts to create realistic nature dioramas, take a look at Stephen Quinn’s Windows on Nature, which came out less than a year ago. Brilliant stuff.)

Hmmm. I’ve been accused of being too upbeat this week, for which I apologize. I’ll try to find something to gripe about in the next day or so. Until then…

Small Bodies, Simple Graph

The image above accompanies Steve Soter’s Scientific American article about the new definition of planets. The image of the solar system deals with the typical issues of scale and two-dimensionality adequately enough, but I really like the little graph just below the center. It shows Soter’s proposed μ values for various solar system bodies, which gives a more mathematical expression to the concept of a planet “clearing its orbit.” (Note that the scale of the bar graph is exponential!)

Now compare the graph to Figure 3 in the astro-ph version of the article. Whereas the astro-ph version uses a standard scientific convention (plotting two quantities and revealing μ as a diagonal line on the plot), the Scientific American version translates the concept into simple visual vernacular. Excellent work.

Rotating Helix

I’m takin’ it easy for Lincoln’s Birthday (he was a distant relation, actually, so I deserve it). Look! A Spitzer image! And no, I’m not just logrolling for my friend Robert. I took a look at today’s press release, and I couldn’t find anything else to blog about, then…

I take a closer look. I thought I’d link to the Hubble Space Telescope picture of the Helix and make some kind of comparison. But when I skipped between the two images, I noticed that the two seemed to be rotated 90° with respect to one another. Odd. For a quick double-check, I took a look at Rob Gendler’s (as always gorgeous) picture of the Helix, and it seems to match Hubble’s.

Here, I’ll save you the trouble and link to an essentially equivalent picture (with the Hubble color scheme) from Travis Rector:

Yep, it’s rotated. Bizarre!

I mean, honestly, it’s not a big deal. But it might be considered a little confusing not to have imagery from the NASA Great Observatories lining up properly.

Otherwise, I was just going to note that it’s interesting how the exterior of the nebula shifts from red-yellow in the Hubble image to blue-green in the Spitzer view: purely a matter of convention, of course, since images are typically mapped by wavelength, with shorter-wavelength light being mapped to (ironically) cool colors and longer-wavelength light to (equally ironically) warm colors. The red haze at the center of the Helix in the Spitzer image indicates a source of small, warmed particles—interpreted to be colliding comets in the aforementioned press release.

The Hubble site offers a “tour” of the Helix, which is quite nice. Perhaps we&rsquo’ll be treated to a different tour in a future interactive—one which shows the nebula not just in optical light, but in its intriguing infrared emission as well.

Stereo(tactic) Photography

Inspiration for today’s image comes from the Merriam-Webster “Word of the Day” today: stereotactic. (Because I subscribe to “Word of the Day” via email, I receive such tidbits on a daily basis. What better blogging inspiration than one’s inbox?)

As I read the definition, I felt that it cried out for an image, and sadly, Merriam-Webster doesn’t indulge its readers (at least its non-paying readers) with such niceties, so I did a quick Google image search. Most of the top results look fundamentally like the image above, but it immediately attracted my attention.

The image comes from the University of Arizona’s Biomedical Communications page of medical photography. It’s categorized as “Illustrative Photography,” along with images as varied as fall leaves, a sunset, and a palm tree silhouette. Ignoring those others for a moment, however, I have to express admiration for the “stereotactic” image.

I like it because none of the other drawings or diagrams I saw gave me any (or at least much) more information than I get from the above, although multiple views of the device could certainly make things clearer. The photo manages to illustrate its concept with remarkable clarity and aesthetic sense. Good work, in my opinion. Perhaps others’s opinions vary?

As an aside, I should add that the Wikipedia article on stereotactic devices actually has no illustrations whatsoever. I wonder if the U of A would put this one in the public domain…?

Face Off

Another brief posting. I ran across an article on EurekAlert claiming that “facial composite systems falling short” that got me looking for a representative image. The one above comes from a 2002 CNN article that implies that such software ives us an “edge over bad guys.” The new study suggests something different, as you might guess.

“In one particular study, only 2.8 percent of participants correctly named a well-known celebrity that had been created by other participants using the face-composite software. In a separate study, participants were unable to discriminate composites of their classmates from composites of students at entirely different schools.”

Doesn’t bode well, eh?

What this underscores is the difference between how the brain processes imagery verus how computer software (for example) processes imagery. As one researcher is quoted, “faces are generally processed, stored and retrieved at a holistic level rather than at the level of individual facial features,” which contrasts with a generally reductionist scientific perspective.

Hmmm. Maybe I noticed this story because of my recent experience in S.F. and because I’ve been warned by several people to watch out here in New Orleans (as one friend put it, “think port city in Victorian England”).

Watch Out!

The little picture above comes from a NASA web page about (obviously enough) Near-Earth Objects. All I can say is yikes! If the space near Earth is that full of stuff, we’d better watch out. It’s almost as bad as The Empire Strikes Back.

Anyway, I apologize for the brief post, but I just arrived in New Orleans and only have network access lounging around the patio of the W Hotel in the French Quarter. I know, hard life. But it’s windfall from an online context, I swear! Anyway, I’ll try to post more later.