Candy’s Bad for You

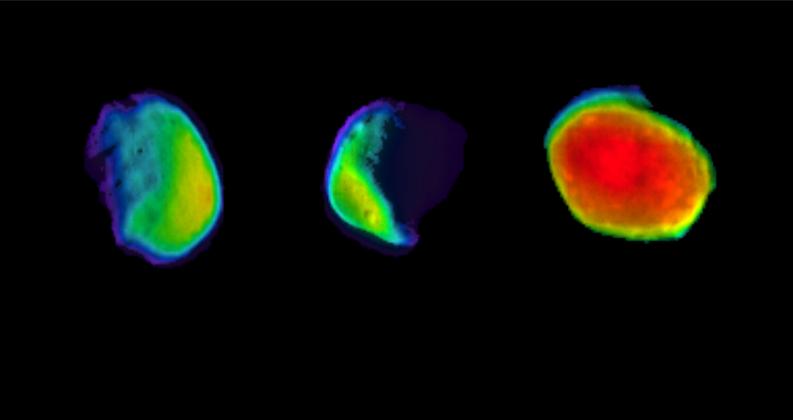
The image above was released as part of a press release entitled, “Why This Martian Full Moon Looks Like Candy.” Geez, what a great question, let me think a minute…

Maybe because you color-coded it to look “like a rainbow-colored jawbreaker” (to quote the press release)? It’s not as if Phobos is actually radiating the ugly rainbow color palette! It was a choice—likely on the part of an ill-informed scientist who created the image and certainly on the part of a lazy press officer who decided to roll with it and compose an insipid headline rather than trying to create an intelligible message for public audiences.

(Sigh. Deep breath…)

To their credit, they at least released a captioned image, too, with accompanying color bar and added information.

And I will note that, what with our possibly intuitive mapping of red to hot and blue to cold—reinforced by water taps and weather maps having long employed red and blue for temperature—there are worse applications of the rainbow palette (for anything other than temperature, basically).

Once upon a time, I wrote thoughtful, nuanced posts for this blog. Now I’m just railing about ending the rainbow! But desperate times call for desperate measures, I suppose, so I’ll just mention that there’s oodles of research out there that demonstrates how the rainbow color palette works against our natural visual perception—an open letter to the climate science community outlines the most egregious issues. I’ll put some more on my resources page soon. “End of the rainbow” even has its own hastag on Twitter!

My real issue with this, at the end of the day, is not even so much the poor (a.k.a. default) choice of color palette as the choice of how to reify the choice by suggesting that the moon of Mars actually looks like candy.

All I can say is, NASA, please don’t give us candy! Give us something nutritious instead.

And maybe next time, I can write about something more substantive, too.

Rotating Helix

I’m takin’ it easy for Lincoln’s Birthday (he was a distant relation, actually, so I deserve it). Look! A Spitzer image! And no, I’m not just logrolling for my friend Robert. I took a look at today’s press release, and I couldn’t find anything else to blog about, then…

I take a closer look. I thought I’d link to the Hubble Space Telescope picture of the Helix and make some kind of comparison. But when I skipped between the two images, I noticed that the two seemed to be rotated 90° with respect to one another. Odd. For a quick double-check, I took a look at Rob Gendler’s (as always gorgeous) picture of the Helix, and it seems to match Hubble’s.

Here, I’ll save you the trouble and link to an essentially equivalent picture (with the Hubble color scheme) from Travis Rector:

Yep, it’s rotated. Bizarre!

I mean, honestly, it’s not a big deal. But it might be considered a little confusing not to have imagery from the NASA Great Observatories lining up properly.

Otherwise, I was just going to note that it’s interesting how the exterior of the nebula shifts from red-yellow in the Hubble image to blue-green in the Spitzer view: purely a matter of convention, of course, since images are typically mapped by wavelength, with shorter-wavelength light being mapped to (ironically) cool colors and longer-wavelength light to (equally ironically) warm colors. The red haze at the center of the Helix in the Spitzer image indicates a source of small, warmed particles—interpreted to be colliding comets in the aforementioned press release.

The Hubble site offers a “tour” of the Helix, which is quite nice. Perhaps we&rsquo’ll be treated to a different tour in a future interactive—one which shows the nebula not just in optical light, but in its intriguing infrared emission as well.

Toppling the Pillars

Today’s press release from the Spitzer Space Telescope shows the Eagle Nebula in a new light. (You can also listen to a podcast about the result.) The Eagle was made famous by the 1995 “Pillars of Creation” Hubble image and perhaps also by the Hubble’s 15th Anniversary image release.

Spitzer is getting into the act now with the gorgeous images above, in addition to an image that came out with the aforementioned press release. The challenge for visualizing the data is that six different filters were used to look at the nebula—3.6-, 4.5-, 5.8-, 8.0-, 24-, and 70-micron filters, to be exact. Since most such pictures are created by assigning three filters to each of the red, green, and blue channels of a digital image, it gets tricky to condense an even greater amount of information into a single snapshot.

The side-by-side presentation of the data helps us piece together the story—namely that the longer-wavelength emission suggests a shockwave of material (most likely from a supervova) coming in from the upper right. It would be interesting to include a tool similar to one on the Hubble education site that would allow a user to turn on or off certain filters and combine them into a single image.

Alternatively, you could take the individual filters’ images from Spitzer and use a tool such as FITS Liberator to constrcut your own color image. (The European Hubble site offers a gallery of images created by users using said tool.)

However it happens, it would be fantastic to experience the images in a more flexible and interactive fashion.

Snake on a (Galactic) Plane

Still at my conference, I’m going to take the easy way out on today’s image. A nifty picture, indeed, although I’m inordinately fond of infrared images, and Spitzer (back when it was still SIRTF) paid for my summer employment back in college, so I might ba a tad biased.

I’m inordinately fond of puns as well, but… Yeesh! That title. On the phone just now, I confirmed that I know the person responsible for it, too. It’s a small astro-viz community out there.

Speaking Warmly of Saturn

Okay, this just proves I’m a whore for astronomy images. I’d already started writing something about PET scans in relation to today’s story about the long-term effects of chemotherapy on brain function, but then I saw the press release for the above image.

In spite of the mediocre resolution (mostly because it’s a composite of infrared mapping spectrometer, which operates in a scanning, single-pixel-at-a-time mode), the image rather intuitively communicates the idea of seeing ”through” Saturn’s clouds.

As described in the caption from JPL, we’re looking at a near-infrared image of Saturn, in which the shorter-wavelength light (shown as blue-to-green) is reflected off the cloudtops whereas the longer-wavelength emission (colored red) from Saturn’s warm interior shines through in shadowed regions, less obviously in the daylit regions. Because most people (stellar astronomers excluded) think of red as warm and blue as cool, this image capitalizes on people’s natural sensibilities. Always a good thing.

This strikes me as a good image to talk about some of the confusing aspects of infrared light, which well-informed people typically perceive simply as “heat,” because that’s what they’ve been told. Of course, the problem with blackbody radiation is that there’s a big contrast issue: yeah, the lower layers of Saturn’s atmosphere may be warm, but their infrared glow gets blocked by clouds in the upper atmosphere, plus it has to compete with the bright, reflected glare of the Sun. The image above allows one to talk about those contrast issues while clearly conveying that infrared light allows us to see things we can’t in visible light. Also, the rings cut across the center of the image as a blue line, indicating that they reflect the short-wavelength infrared light but don’t emit much thermally—pretty much as one would expect from chilly rings made mostly of ice.