Missing Link, Missed Opportunity

The above image of a 40,000-year-old skull named “Oase 2” accompanies a press release from the University of Bristol describing how the skull represents a potential intermediate between modern humans and Neanderthals. Allow me to quote at length…

“By comparing it with other skulls, Professor Zilhao and colleagues found that Oase 2 had the same proportions as modern human crania and shared a number of modern human and/or non-Neanderthal features.

“However, there were some important differences: apparently independent features that are, at best, unusual for a modern human. These included frontal flattening, a fairly large juxtamastoid eminence and exceptionally large upper molars with unusual size progression which are found principally among the Neanderthals.”

All well and good, but hey, couldn’t we get some kind of visual representation of that? I mean, I don’t expect to become a paleontologist just by glancing at an image with a press release, but wouldn’t it be keen to point out, I dunno, the aforementioned frontal flattening? Or maybe show me what exactly is meant by “juxtamastoid eminence”? Just to give the reader a sense of what the scientists are looking for. Instead, we get the above: 180 by 185 pixels of black-and-white imagery.

Speaking of black-and-white, what’s the strip at the bottom? I’m guessing it shows scale, but we should either be told what the scale is or we should use Photoshop to get rid of it!

The version of the press release from EurekAlert does a little better: a view of the front of Oase 2 offers more resolution, if nothing else (and the little black-and-white strip appears once again, albeit at the right of the image).

Another missed opportunity.

ESA to Use

I stumbled across ESA’s MERIS Images RApid VIsualization (MIRAVI) page just today. “MERIS” stands for Medium Resolution Imaging Spectrometer, an instrument onboard Envisat that measures solar radiation reflected by the Earth in fifteen regions of the visible and near infrared spectrum; it images the entire surface of Earth every three days. The image above happens to have been the most recent image when I first glanced at the page: the Dominican Republic and Puerto Rico as they appeared this morning (my time).

I like the interface to the data. A map on the right had side allows you to select what part of Earth you want to explore, searching for images of whatever part of the globe you zoom in on. Images appear on the left, and when you select one, its area appears in red on the global map. Nice, simple, straightforward. I love Google Earth, don’t get me wrong, but this interface to rapidly-updated data does a good, no-frills job.

Inside the Image, from B to Z

A friend just pointed out to me that Apple has launched a feature called “Inside the Image” on its science site. Perhaps this is a prelude to the Image and Meaning 2.3 workshop being hosted at Apple HQ in Cupertino (I’m going to attend, actually), since the first “Inside the Image” is written by none other than Felice Frankel, who started Image and Meaning several years ago…

It looks like I now have some competition in the science imagery blogging game (although I don’t expect that the Apple page will updated on a near-daily basis), since the site is devoted to describing “how images made in laboratories and publications in science advance our understanding of the world around us.”

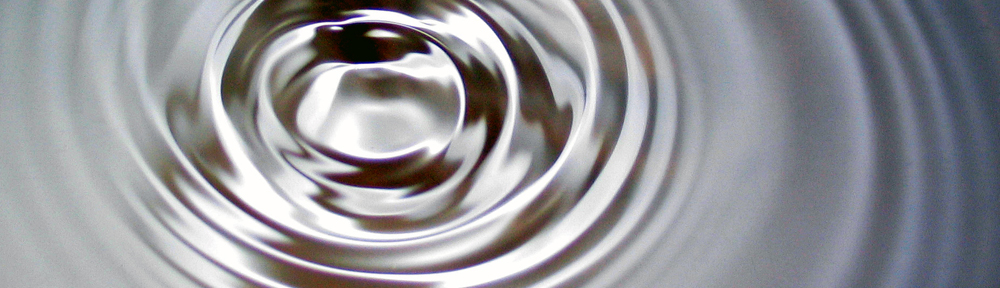
The first installment discusses the images above and contrasts the time-sequenced grid with a sequential display of the images played out as a film of sorts. The images show a Belousov-Zhabotinsky reaction, a nonequilibrium chemical reaction that can result in oscillating patterns. Typical of Frankel’s imagery, the above distills the event with stunning elegance and simplicity, as if she had photographed the Platonic ideal of the experiment. (Compare Frankel’s elegant images to a gallery of others’ attempts at capturing the same sort of reaction. She’s good! Look for many more examples, along with detailed descriptions of how she works, in her book, Envisioning Science: The Design and Craft of the Science Image.)

Frankel ends her column with a rumination… “ If we study one frame next to another, as we may here in this grid, we might get to see ‘more’ in a way. We can compare one moment to the next and truly see more of what’s going on. See for yourself. Are you seeing the same information in both of these visual expressions of the B-Z Reaction?” Frankel’s tentative query suggests an argument from Susan Sontag’s (brilliant, I should note) On Photography, which privledges the still photographic image over the film or video. The difference lies in subject matter: Sontag addresses imagery rooted in the real world, in experiences not far removed from our day-to-day existence, whereas Frankel’s photography most often traffics in abstractions of highly specific and elusive scientific “moments.”

In short, I’m not sure that viewing the images side-by-side allows us to “compare one moment to the next and truly see more of what’s going on.” I have previously argued in this space that a sequence of images arranged as a film clip often permits one to see relationships that are easily missed when the same images are viewed in the comic-strip style above—admittedly, those were images showing the extremely subtle effect of lunar libration, but that kind of direct comparison, cross-fading from one still image to another, shown at the same scale, provides an excellent opprtunity to notice minute differences.

Furthermore, I would point out that a grid-like arrangement of images does not always indicate time-resolved data—a grid of MRI images, for example, often shows spatially-separated “slices” of a brain.

So there’s a place for both arrangements, but in general, I prefer to see time-sequenced images organized temporally, not spatially.

One final gripe. I’m also slightly annoyed by the incomplete information given about the reaction: we’re told that images were captured every 11 seconds, but then Frankel admits that she “edited the number of images down to 12 to create this grid in Photoshop on my Mac,” leaving me to wonder how long this reaction actually took. I mean, it’d be nice to know…

All for McNaught

The image above comes from the SOHO “latest image” gallery, which shows the latest pictures from the Solar and Heliospheric Observatory (SOHO). An article on their website describes the passage of Comet C/2006 P1 (McNaught) through the satellite’s field of view.

The comet is passing close enough to the Sun to enter the field of view of the Large Angle and Spectrometric Coronagraph (LASCO), which normally monitors the faint glow of the Sun’s corona. Because the comet shines much more brightly than the tenuous gas flowing outward from the Sun, it appears as a bright, washed-out swath in the upper left of the image. What’s wonderful about the picture is that it’s data, collected in a somewhat clinical, unexciting fashion, that happens to show an unusual, transient phenomenon in our solar system.

Earthbound images of the comet can be found in a gallery of pictures taken from the ground.

Uncoiled Molecules

In an article from EurekAlert that doesn’t seem to appear on the Penn Medicine news site, the above image appears as an illustration of how blood clots exhibit stretchiness. The caption tries to explain, but… “Fibrinogen molecule pulled by probe of the atomic force microscope (yellow disk) stretched 23 nanometers by the uncoiling of three, tightly coiled coils within the molecule.” You just know the poor writer was, like, “Is there some word I can use besides ‘coil’?” To which the researcher evidently balked.

What’s evidently going on here is that the uppermost segment of the fibrinogen molecule uncoils (allowing it to stretch to more than twice its rest length) when tugged on. I actually had trouble seeing it right off the bat because the three lines that connect the top portion of the righthand molecule didn’t read as the same structure as on the left. Instead, the three nearly-straight lines on the right looked cartoonish, and it took me a moment to identify them as anything more than diagrammatic elements. Perhaps they could be illustrated as something a little more geometrically complex, or maybe one could have a third step in the series, showing an intermediate, partially-coiled state. An animation could be spiffy, too.

The other thing that gave me pause was wondering how they know that it’s only the uppermost segment that strecthes (um, sorry, uncoils). Of course, maybe they don’t. One of the researchers is quoted as saying, “But, how is the stretching happening at a molecular level? We think part of it has to be the unfolding of certain parts of the fibrin molecule, otherwise how can it stretch so much?” So the cartoon may in fact be showing something that differs considerably from reality. Tsk, tsk.

A Decade Apart, But…

Having returned to New York from the American Astronomical Society meeting in Seattle, I thought I might blog about a non-astronomical topic. But then I saw the latest image from the Mars Reconnaissance Orbiter HiRISE camera. Astronomy it is!

The above image (listed under “Topographic Map of Landing Site Region” on the aforementioned HiRISE page) shows the location of the Mars Pathfinder: the HiRISE image forms the background, while the color-coding (in addition to contour lines visible in higher-resolution images than the one above) represents the same topography as reconstructed from the stereo imagery from the Pathfinder itself. So we’re comparing two very different data sets here, collected nearly a decade apart. Normally, false-color imagery makes me wince, but I have to admit that the picture above makes good use of the technique.

You may also recall the famous panoramic image taken by the Mars Pathfinder, and the new HiRISE page offers a variation that shows the Sojourner rover at various points in its exploration of the site. The latter image has labels that match the false-color image above, so you can try to imagine the site from two very different perspectives, in much the same way that an earlier HiRISE image was coupled with Opportunity data.

Toppling the Pillars

Today’s press release from the Spitzer Space Telescope shows the Eagle Nebula in a new light. (You can also listen to a podcast about the result.) The Eagle was made famous by the 1995 “Pillars of Creation” Hubble image and perhaps also by the Hubble’s 15th Anniversary image release.

Spitzer is getting into the act now with the gorgeous images above, in addition to an image that came out with the aforementioned press release. The challenge for visualizing the data is that six different filters were used to look at the nebula—3.6-, 4.5-, 5.8-, 8.0-, 24-, and 70-micron filters, to be exact. Since most such pictures are created by assigning three filters to each of the red, green, and blue channels of a digital image, it gets tricky to condense an even greater amount of information into a single snapshot.

The side-by-side presentation of the data helps us piece together the story—namely that the longer-wavelength emission suggests a shockwave of material (most likely from a supervova) coming in from the upper right. It would be interesting to include a tool similar to one on the Hubble education site that would allow a user to turn on or off certain filters and combine them into a single image.

Alternatively, you could take the individual filters’ images from Spitzer and use a tool such as FITS Liberator to constrcut your own color image. (The European Hubble site offers a gallery of images created by users using said tool.)

However it happens, it would be fantastic to experience the images in a more flexible and interactive fashion.

The Depth of Aesthetics

So, I’m just going for aesthetics here. This new image of NGC 602 from Hubble looks great, doesn’t it? I enjoy how it achieves a wonderful (taken as literally as possible) sense of depth—in the nebula and beyond!

First off, the warm tones of the narrow-band emission trace out the presence of ionized gas, gas that’s been heated by the intense light from the cluster of stars near the center of the image. The continuum emission appears in cool colors, which yields a sense of depth. Cool, bluish colors appear to recede compared to warm, reddish colors—a natural repsonse to the everyday world, since atmospheric scattering makes more distant objects appear bluish (imagine the background of a Leonardo painting). This is somewhat deceptive since some of the ionized material may easily be more distant than the continuum, but overall, it gives a good impression of the dimensionality of the nebula.

But take a closer look! In the middle left of the image, you can easily spot a nearly face-on spiral galaxy (I didn’t take the time to figure out which one). And many other galaxies are scattered across the image, if you feel inclined to scrutinize a higher-resolution image or look at the Zoomify version.

NGC 602 is about 200,000 light years away, in the Small Magellanic Cloud, but the tiny galaxies are probably tens of millions of light years more distant. Talk about depth!

Dark Matter Blobs!

Reporting from the American Astronomical Society meeting in Seattle, Washington… In a brand spankin’ new press release from Hubble, we have the first-ever “3D map of the Universe’s Dark Matter scaffolding.”

First off, the result is quite kewl. We’re beginning to map the stuff that “outweighs” ordinary matter by a factor of six to one. Great work, COSMOS team!

The above image isn’t the primary image released, but it’s the one with which I find the greatest fault. By abstracting the blobs of dark matter without any reference to scale whatsoever, we’re left with no sense of how large the object is that we’re looking at. The primary image that accompanies the press release improves on the problem by labelling slices at 3.5, 5.0, and 6.5 billion years ago, but the size of the image on the plane of the sky is left undescribed—although the caption does clarify that “Each panel represents an area of sky nine times the angular diameter of the full Moon.”

Images such as the one above do a disservice to public understanding of astronomers’ work by abstracting the result completely from reality. The lack of scale I already complained about, but I have other issues as well“ The use of isosurfaces is non-intuitive for the vast number of people. The inclusion of half a box around the data provides a sense of dimension but could also confuse people. And a meaningless background haze does nothing in service of the rest of the image.

Great science, bad picture.

Random Seattle Posting

I just arrived in Seattle, Washington for the 209th Meeting of the American Astronomical Society (AAS). I couldn’t find anything else to blog about, so I decided to point out a rather spiffy aeromagnetic survey of Puget Sound.

I didn’t spend a lot of time trying to figure out the above image, but it’s not the easiest thing to read (however interesting the data is). The white line represents the coastline and the color represents the intensity of the magnetic field, but… What exactly is going on with the faux terrain shading? I’m not quite sure.

Anyway, the next few days will probably be taken up with a lot of astronomy stuff as I blog about whatever I see around the meeting. You’ve been warned!