Image and Meaning

As I mentioned in my previous post, I attended the Image and Meaning workshop held at Apple Computer’s Cupertino campus. It feels as though there’s an increasingly large number of people thinking about how images are used to convey scientific concepts, and it was a thrill to hang out with folks and discuss what we do and what troubles (and excites) us.

The core of the workshop took place in the break-out sessions with less than a dozen people. The image above comes from my section’s discussion. Each of us had identified two images prior to the meeting—one we deemed successful and another we found problematic. During our session, we drew two axes on a sheet of butcher paper: one ranged from “specific” to “general” audiences (although “specialist” to “novice” might be a better pairing) and the other from “iconographic” to “realistic.” We then placed our images on the conceptual plane. It stimulated some good discussion.

What I really enjoyed was hearing the perspective of people coming from a variety of backgrounds. In our group, we had everyone from graphic designers to mathematicians, working on problems from earthquake analysis to interstellar gas clouds, for audiences as diverse as professionals to schoolchildren. (One of the mathematicians, Daina Taimina at Cornell University, crochets hyperbolic objects.) Yet we found surprising common ground, and I think everyone would claim to have benefitted from the experience. Yay!

If I have a chance, I&rdsquo;ll try blogging about at least one of our other activities. All in all, I found my day and a half in Cupertino quite stimulating.

How Do You See Invisible Nutrients?

This is actually a bit of a follow-up to my post from last night, in which I discussed visualizing invisible germs. As I read through Michael Pollan’s brilliant article from Sunday’s New York Times Magazine, I decided that there was something of a connection. In describing political lobbies’ removal of specific (“red-meat and dairy”) language from government recommendations, he writes, “the culprit is an obscure, invisible, tasteless—and politically unconnected—substance that may or may not lurk in them called ‘saturated fat.’ ” Invisible indeed! How do we think of things that lie beyond our senses?

(As a brief aside, I can’t emphasize “brilliant” enough in describing Pollan’s work. I find myself recommending his two most recent books, Botany of Desire and Omnivore’s Dilemma, more than pretty much any other reading material.)

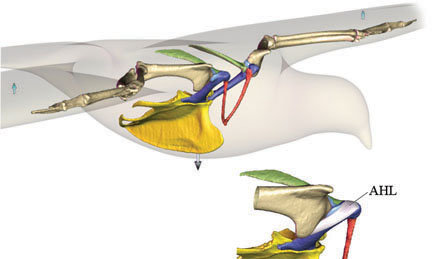
So the image above is literally the first one that crops up (um, so to speak) when you google “nutrient“ as an image search. Of course, no nutrients are visualized in the diagram, but something interesting happens instead: nutrients are visualized as the relationships between the organisms in the diagram. Following the lead of the little pictures of cows and corn, perhaps the “Nitrogen Fertilizers” box should have a little drawing of a factory, but the key is that the obscure and invisible is envisioned in terms of connections between the concrete and mundane. (Obviously, the emphasis lies on a single element in the intricate relationships between the various parts of the diagram, but the sheer number of arrows communicates the system’s implicit complexity.)

Indeed, in both his books and in the article referenced above, Pollan focuses on the relationships between humans and plants—between us and our food—and the two-way, co-evolutionary nature of those relationships. He describes a “nutritionism” worldview, in which “the widely shared but unexamined assumption is that the key to understanding food is indeed the nutrient. From this basic premise flow several others. Since nutrients, as compared with foods, are invisible and therefore slightly mysterious, it falls to the scientists (and to the journalists through whom the scientists speak) to explain the hidden reality of foods to us. To enter a world in which you dine on unseen nutrients, you need lots of expert help.”

This turns out to be a critique of strict scientific reductionism as well as an indictment of a food culture that emphasizes listing “dos” and “don’ts” rather than taking a more holistic approach to eating. Pollen therefore recommends going back to eating food instead of “edible foodlike substances,” but he also calls for consideration of the other cultural accoutrements of dining—growing and preparing food, sharing communal meals, and so forth. “In borrowing from a food culture, pay attention to how a culture eats, as well as to what it eats.”

In terms of “visualizing science,” what I find intriguing about these ideas is that they don’t lend themselves to a visual interpretation. Unlike yesterday’s germs, which lend themselves to caricatures and cartoons, the idea of a “nutrient” cannot be expressed in a terribly concrete visuals; instead, one must use diagrams or sequential art to place it into a real context. Thus, you end up with a picture like the one above, revealing a nutrient in terms of its relationship to entities we can visualize.

A detail I rather enjoy about the image, BTW, is the only color that appears—in the form of a lightning bolt! Indeed, lightning plays a role in the nitrogen cycle, although its importance may be visually exaggerated by the use of color. Still kinda cute.

Please forgive a slight digression now as I shift from the visual to the literary… Because I just happened to read Charles Dickens’s ”American Notes for General Circulation, I feel compelled to quote a portion of his chapter describing a trip “From Pittsburg To Cincinnati In A Western Steamboat”: “Nobody says anything, at any meal, to anybody. All the passengers are very dismal, and seem to have tremendous secrets weighing on their minds. There is no conversation, no laughter, no cheerfulness, no sociality, except in spitting; and that is done in silent fellowship round the stove, when the meal is over. Every man sits down, dull and languid; swallows his fare as if breakfasts, dinners, and suppers, were necessities of nature never to be coupled with recreation or enjoyment; and having bolted his food in a gloomy silence, bolts himself, in the same state.” So Americans’ poor relationship to food dates back as far as 1842!

Bent Light, Broken Caption

Too much to blog about! I’m getting backlogged… And just to complicate matters, here’s a new graphic from the European Sapce Agency that’s too much to pass up.

The image above shows Titan, Saturn’s largest moon, as seen in a slightly odd mix of visible and infrared light (if you really must know). The white line beneath Titan shows a “light curve,” which represents the intensity of light on the vertical axis, time on the horizontal axis, indicating the brightness of the star measured as it “passed behind” Titan through a trick of rotational and orbital dynamics in our solar system. The dimming of the star as it passes behind Titan reveals information about the moon’s atmosphere, and the peak of light in the center shows that the atmosphere acts like a lens, focussing light from the opposite side of the planet. The press release goes into some detail about how much we can learn from such observations, right down to predicting a bumpy ride for a spacecraft!

Now, I won’t claim my explanation above as the be-all-end-all, but I think the caption on ESA’s page doesn’t offer enough information about what’s going on in the still image. It never explains the term “light curve,” for example. I understand the reluctance to put words on the graphic (not so much for NASA, but for ESA serving a multilingual constituency), but the caption should compensate.

The animation of the graphic shows what’s happening much better, and I imagine the still image will make sense to people once they’ve seen the animation. N.B. that the caption for the animation is the same length as the caption for the still image—a stylistic requirement, I’m guessing. But the still image, with so much less information in it and so much more information implied by it, requires more verbiage to support it.

Quarks of Many Colors

I have to say, I’m kinda floored by this one.

The above image is associated with a December 2004 press release entitled “Jefferson Lab’s journey into the nucleus” that I ran across completely by accident. The non-animated version caught my eye, in part because of the caption: “An artist’s impression of a quark being struck by a virtual photon (a). As the quark propagates through nuclear matter, it loses energy by emitting gluons (b) and creating pairs of quarks and anti-quarks (c). As the system begins to return to equilibrium, two-quark systems (pions) are formed (d).” Admirably, it starts right off with the phrase “artist’s impression.” And quite an impressionistic impression at that!

The caption that appears with the above, animated image (and, inexplicably, the title “Simple Experimental Simulation”) could use a similar qualification, in my opinion: “This movie illustrates the action inside the nucleus of a deuterium atom containing a proton and a neutron, each with three quarks. An electron strikes a quark inside a proton, passing energy to the quark before the electron bounces back. The quark now has so much energy ‘stuffed’ into it, it creates a cascade of new particles as it flies out of the proton. The result is two new, two-quark particles.”

First off, I have to note that having the GIF loop creates a problem, namely that the linear process of the reaction is shown blending back into itself. Awkward to say the least. Initially, I was inclined to blame my browser, but then I took a closer look at the file and noted that it seemed to be designed to loop, and indeed, a quick check with Adobe ImageReady revealed it to indeed be designed as a loop. Yikes! Ideally, there would at least be a few frames of black between the end and the beginning of the sequence, but to design it to loop continuously is highly misleading.

Of course, there’s plenty of misleading aspects to this representation. Basically, what we’re looking at is a Feynmann diagram, which is normally shown as a tinkertoy-type diagram of lines and squiggles (tinkertoys and springs, I guess). The imagery above includes a lot more information—colors represent different types of quarks, for example—which strikes me as rather clever and quite aesthetically pleasing, but…

What troubles me about the image is that it’s using a somewhat representational style to illustrate a fundamentally abstract concept. The almost biological quality of the pions slithering off toward the end may be rather striking, but what does it mean? In terms of communicating the underlying concepts, well, I hate to sound boring, but a more straightforward approach may be better suited. I admire Jefferson Lab for trying something different, but caution is required—or at least a cautionary note!

The initial caption, clearly indicating “artist’s impression” from the get-go, addresses my cautionary concerns, but it’d be even better if there were a brief essay by the artist involved. What choices did he or she make in creating the image? What do the colors mean? What motivated the somewhat biological look of the illustration?

In a medium better known for its objectivity than its artistry, a diagram may deserve a colorful interpretation, but as always, the subjective layer may add unintended meanings.

Einstein, Illustrator

I have to say that the speakers at the Science and Society Conference, which I happen to be attending, seem averse to using much imagery in their presentations. We’ve seen a video clip and a few PowerPoints, but not as much as I was counting on. In part because I had hoped to blog about and belit—er, critique them here.

Interestingly, in his talk, Gerry Wheeler inserted a diagram similar to the one above (sans kanji). It’s adapted from a letter Einstein wrote to Maurice Solovine on 7 May 1952, depicting a diagram of Einstein’s epistemological view of the scientific process. Briefly, “E” represents the world of sense experience, “A” the axioms of science, and “S”es the specific statements (predictions) that result from the axioms. Arriving at the axioms occurs through a process of “intuitive connection,” according to Einstein, but lead to the specific statements that can be compared to the real world of experiment and experience.

I’m curious why Einstein chose to sketch the idea in such a manner; I’ve looked over some of his papers (my institution organized an entire Einstein exhibit, after all), but he didn’t seem like much of a sketcher to me. And I haven’t asked Wheeler, but I’m curious if part of the reason he highlighted the diagram is because, well, it’s a diagram.

A diagram (particularly in a letter) stands out on a page. It draws your attention. And if you’re at all visual, which I think most folks are, then it may very well stick in your head, becoming a stand-in for the concept it represents. At first glance, it’s hard to see why Einstein would bother sketching this very conceptual and abstract process, but as a communication technique, it certainly makes the point well.

And perhaps, too, the concept resided in Einstein’s brain in a visual way. Perhaps the sketch was the most obvious means of expressing his thought.

I dunno. Perhaps.

Anyway, you can find a low-resolution scan of the actual letter on a Japanese web page describing its contents (Babelfish does an interesting job translating the page, BTW). I assume it’s also reproduced as part of an American Psychotherapy Association article I found, but I didn’t shell out the five bucks to find out—regardless, the article offers a translation of the letter for free! You can also look for a copy of Letters to Solovine, which includes the letter (and many more) in its entirety.

Uncoiled Molecules

In an article from EurekAlert that doesn’t seem to appear on the Penn Medicine news site, the above image appears as an illustration of how blood clots exhibit stretchiness. The caption tries to explain, but… “Fibrinogen molecule pulled by probe of the atomic force microscope (yellow disk) stretched 23 nanometers by the uncoiling of three, tightly coiled coils within the molecule.” You just know the poor writer was, like, “Is there some word I can use besides ‘coil’?” To which the researcher evidently balked.

What’s evidently going on here is that the uppermost segment of the fibrinogen molecule uncoils (allowing it to stretch to more than twice its rest length) when tugged on. I actually had trouble seeing it right off the bat because the three lines that connect the top portion of the righthand molecule didn’t read as the same structure as on the left. Instead, the three nearly-straight lines on the right looked cartoonish, and it took me a moment to identify them as anything more than diagrammatic elements. Perhaps they could be illustrated as something a little more geometrically complex, or maybe one could have a third step in the series, showing an intermediate, partially-coiled state. An animation could be spiffy, too.

The other thing that gave me pause was wondering how they know that it’s only the uppermost segment that strecthes (um, sorry, uncoils). Of course, maybe they don’t. One of the researchers is quoted as saying, “But, how is the stretching happening at a molecular level? We think part of it has to be the unfolding of certain parts of the fibrin molecule, otherwise how can it stretch so much?” So the cartoon may in fact be showing something that differs considerably from reality. Tsk, tsk.

CG Takes Flight

A press release from Brown University describes the evolution of structures required for flight. Turns out that a specific ligament (labeled “AHL” in the above image) provides stabilization to maintain a gliding posture in pigeons—computer modeling permitted the calculation of the necessary forces and also resulted in a pretty spiffy image to illustrate the findings. It actually took me a moment to see the symmetry in the image, but as soon as I “read” the pigeon’s beak pointing to the right, it snapped into place. Nice work.

The caption for the above reads, entertainingly enough, “Using computer modeling, treadmills and the fossil record, researchers have shown that the acrocoracohumeral ligament (AHL), a short band of tissue that connects the humerus to the shoulder joint in birds, was a critical element in the evolution of flight.” The treadmills, BTW, came into play when alligators (close but obviously flightless relatives of the birds) were x-rayed while walking; researchers found that muscles, not ligaments, supported the shoulder. The fossil record seems to indicate that the ligament structures evolved gradually.

Also, it’s worth noting that the image is credited to the researcher himself, David Baier, who seems to have recently gotten his Ph.D. It’s great to see imagery coming directly from the person doing the work. The Brown University Ecology & Evolutionary Biology Newsletter from May 2004 describes some related work and makes mention of Baier.

Cycling on Water

Images like the one above would captivate me as a child. Better even than some Richard Scarry book, they offered a chance to escape into a single-image story that quite often related to the real world (or universe) around me. I specifically remember water-cycle images as utterly entrancing.

I came across the above in a NASA press release on changes in freshwater distribution, which has some other interesting images that I’ll get to in a moment. But the diagram showing the water cycle usually has lots of arrows in it, kind of like the one associated with the Wikipedia article on the topic. But this one goes for a more organic style, replete with numerous labels (e.g., “soil heterogeneity”) but only a few, sparsely distributed arrows. I’m not sure I feel the connections as well as I’d like.

Of course, nowadays, one also has animations to illustrate the process, such as the 44.0MB epic (oddly entitled “EnergyUncomp640.mpg”), also linked to by the press release. In the animation, we see elements of the water cycle played out in sequence—cleverly coincident with the day-night cycle, beginning at dawn with evaporation and ending at night with clouds disappearing stage right. Again, no arrows. I wonder if the temporal element obscures the underlying process… In other words, does the beginning-to-end sequencing of a cycle not do justice to its cyclicity?

Nitpicks, but… I’m curious.

Both the animation and a high-resolution version of the above show up on GSFC’s excellent “Water Cycle” site, which offers much more detail on the processes involved and pays special attention to the human role in the environment.

But back to the aforementioned press release. It also shows diagrams of data from the Gravity Recovery and Climate Experiment (GRACE), which appear along the right-hand side of the web page (too tricky to reproduce here, since they show up as either uselessly tiny or overly large images on the site). One thing I like about the two images is that they use the same color scale (i.e., a given color represents the same quantity in both images); unfortunately, the color bar is unlabelled, so we have no idea what the units are, or really, what quantity we’re talking about at all. What annoys me, however, is that the sorry old crimson-to-violet color bar rears its ugly head, so we have a rainbow of colors with no logical change represented by, say, the shift from warm colors to cool colors (if there is such a meaning, it’s not described in the captions or in the text of the press release).

So, for example, if we have a map of the United States like the one shown in the press release, I’d want to know that the red regions represent, say, areas with decreasing water resources whereas green regions represent increasing freshwater availability. The color bar wouldn’t have to be labelled with units, but including words that describe what the colors mean would be nice—certainly better than numbers devoid of any context.

The GRACE website also includes a truly bizarre visualization of Earth’s gravitational anomolies. I, um, really don’t know quite what to say. Perhaps I should sleep on it…

Pencil versus CAD

A Monday-afternoon lamentation on seeing ESO’s press release on the European Extremely Large Telescope. I noticed the above computer-generated rendering of the telescope, and I reflected back on my recent trip to Pasadena, where my coworkers and I wandered along the corridors of the Caltech astronomy department admiring the drawings of Russell W. Porter, who created remarkable illustrations of many of the telescopes at Mount Palomar.

Caltech’s archives offer mediocre reproductions of Porter’s work, but Bruce Weertman has assembled a much more impressive page of the drawings. Nothing compares to seeing the originals, however, and although I have heard tell of a book collecting his work, my (admittedly cursory) searches haven’t revealed anything definitive.

Looking at the above image, the little tiny figures on the lower half of the (oddly shiny) disk show two people and a pick-up truck to scale with the rest of the telescope. Extremely large indeed! Porter provides a similar sense of scale in virtually all of his drawings (an overview of the 200-inch telescope at Mt. Palomar, for example), and many of his illustrations also show the path light follows through the telescope in addition to mechanical deatils such as gears and supports. He packed a lot into his work.

According to an article on Kevin Hulsey’s website, “famed artist Maxfield Parrish was quoted as saying the following about Porter’s drawings: ‘If these drawings had been made from the telescope and its machinery after it had been erected they would have been of exceptional excellence, giving an uncanny sense of reality, with shadows accurately cast and well nigh perfect perspective; but to think that any artist had his pictorial imagination in such working order as to construct these pictures with no other mechanical data than blue prints of plans and elevation of the various intricate forms is simply beyond belief.’ ”

Long before CAD programs made the job easy (or at least easier), Porter sketched out spectacular visualizations of these phenomenal mid-century achievements. I wonder what we lose by working in an almost exclusively computer-generated realm nowadays. I’m not suggesting going back (necessarily), but… Just wondering.

Cellular Derailment

The weekend is wrapping up, I just got back from a long weekend in Chicago (without too many delays), and friends I ran into on the subway complimented me on this blog… I should be able to find something nice to say. But no.

I came across the above image in a press release from the Berkeley lab entitled “Regulating the Nuclear Architecture of the Cell” (which has a lot to say about how genetic material clumps in the nucleus, none of which I will discuss because I’m going to obsess over the accompanying image). Even though the press release also presents a nice picture of mutant cell nuclei and a straightforward conceptual diagram on the topic, the article leads with the above image. Why, why, why, why? I beg of you, please tell me why.

I can guess why. I’d call it the “planetarian effect,” simply because that’s where I first encountered the problem, but I suppose it could be called the “press-release effect” or “the b-roll effect” or something similar. In the classic planetarium show, cobbled together by a staff (often at the last minute), one often encounters a line of reasoning to pair images with text: “Hey, we mention the Horsehead Nebula here, so where’s a picture of the Horsehead Nebula?” And the first image that you can find is one that, yeah, shows the Horsehead, but it’s kinda small, since the picture really shows all of Orion’s belt, but at least it’s got the Horsehead in it, so the slide gets dropped in the slide tray (or the JPEG added to the file), and you end up with an image in your show that potentially causes viewers to stop, wonder what it has to do with the narration in the show, and get distracted by imagery that should in fact be helping people understand what’s going on.

I’m guessing that’s what happened here. The thought process probably went along the lines of… “Oh, we’re doing a press release on the nucleolus, so we should have an image that shows what that is.” An absolutely correct and well-intended goal! But then you have to find a decent image. And IMNSHO, the above does not qualify. The relevant part of the caption reads, “The nucleolus (dark blue) resides within the cell nucleus, surrounded by heterochromatin.” Okay. But how does the image fit into the cell as a whole? Is the entire thing the nucleus or just the blurry, less-pixelated part? And how ’bout those heterochromatin? Maybe those are the little diamond-shaped blobs? (Take a look at the Wikipedia article on “cell nucleus” for a decent image of a cell, which might help answer some of those questions. It’s actually quite similar to the one above, but with better labels and clearer lines—and intriguingly similar color choices.)

If you’re lucky, an uninitiated reader will shake their head slightly and continue reading the article. But you run the risk of losing them entirely! All because a poor image distracts or confuses them. The best intentions can completely derail your audience.

Or maybe I’m just grumpy after dealing with Newark and O’Hare in the same day.