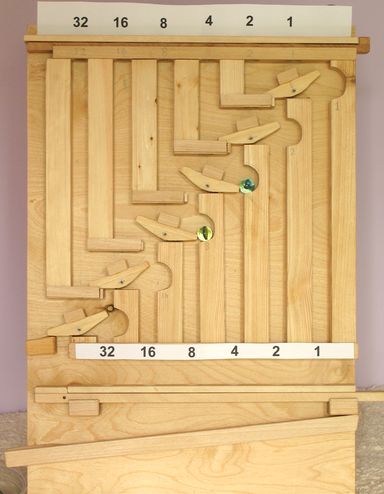
Visualizing Addition

Matthias Wandel’s webpage describing his “binary marble adding machine” includes a YouTube clip as well, but for math geeks, the point should be clear from the above. Dropping marbles from the top of the gadget changes the state of the little toggles (a.k.a. “flipflops”), trapping some marbles and allowing others to fall through. Very kewl.

And one of the only physical demonstrations of binary addition I’ve ever seen. I mean, sure, there are applets online that will show you how to add binary numbers, but the wooden example above feels to me like a step that will bring you closer to understanding something like a circuit description of a binary adder. Perhaps someone with more intimate knowledge of computer circuits could draw some parallels… Do the wooden “flipflops” correspond to XOR gates?

Molecular Dominoes

A press release from the National Institute of Standards and Technology (NIST) uses the above image to describe “the growth of a layer of molecules as they gradually cover the surface of a small silicon rectangle.” Unfortunately, the image doesn’t seem to illustrate much at all.

As usual, I’ll quote the entire caption… “Schematic of the monolayer self-assembly process studied by the NIST/NCSU team. The silicon substrate is approximately 1 x 5 cm in dimensions. The source (left) is a mixture of organosilane (OS) molecules and parafin oil (to control the evaporation rate.) The whole system is enclosed in a Petri dish. The concentration of OS molecules is higher near the source and the ordering process initiates near this region. Molecules behind the advancing self-assembly front are relatively ordered, while molecules ahead of the front are engulfed and incorporated as the front reaches them. The molecules at the leading edge of the front are less ordered and this region becomes broader as the front advances—this is the key phenomenon measured in the experiment.”

Um, right.

Basically, to illustrate such a phenomenon, you’re probably better off using a series (i.e., at least a pair) of images to show, for example, an “advancing self-assembly front.” As it stands (or, in the case of the molecules on the right-hand side, leans), the image doesn’t really reveal the process very well.

Furthermore, if you read the accompanying press release, you find that the actual observations show irregularities in the advancing front, with variations in density that the simple model does not explain. So although the illustration receives top billing with the press release, it doesn’t actually show us what’s interesting about the press release!

An AVI available with the release claims to show “a mean field reaction-diffusion model of the monolayer self-assembly process,” but I couldn’t get the movie to play on my Macintosh.

Poor Label Placement

Image taken from an ESO press release about targeting dim objects near bright ones.

I was going to make just one snarky comment: namely, that one should be cautious where one places text in a contour plot… Or else one ends up with a small, circled “A” that misleadingly suggests the wrong location for an object.

Then I looked at the image and asked myself why the heck the contour lines were there at all (except to add visual confusion). As far as I can tell, they simply represent the same data shown by the pseudocolor image underneath. In other words, we’re being redundant on top of placing text poorly and haphazardly on the image.

Why do people insist on the entire freakin’ rainbow for their pseudocolor images? Is it because they’re trying to use up ink in their printer cartridges at an even rate? Is it because they can’t walk to their nearest public library and pick up an Edward Tufte book that will help set them straight?

Sigh. It’s been a long day. Time to go to another meeting…

Pull My Finger

New York Magazine recently posted “The Science of Gaydar” to its site, which uses the above figure to illustrate one of various physical attributes that are statistically correlated with sexual orientation (straight on the left, gay on the right, by the way). Others include fingerprint density, hair whorl direction, and handedness. With minimal captioning and added text, the magazine’s designers have created a sequence of simple, easy-to-understand images. Admittedly, it’s not exactly rocket science, but clarity and elegance go a long way in my book.

For example, note how the type in the above image guides you toward seeing which digit is longer. Placing the text above and below the dotted line gives you a tiny bit more information than you would otherwise have, and the result is both aesthetically pleasing and impressively lucid. Great work!

FYI, my index finger is indeed longer than my ring finger. Go figure.

Colorbar Confusion

A press release from Purdue University describes the effect of greenhouse gas emissions on “heat stress,” using the diagram above to illustrate the difference in effect between accelerated emissions (top) and decelerated emissions (bottom). A description from the web page:

“This image illustrates heat stress in the 21st century for two greenhouse gas emissions scenarios. The top panel shows the expected intensification of the severity of extreme hot days given accelerating increases in greenhouse gas concentrations. The bottom panel shows the expected decrease in intensification associated with decelerated increases in greenhouse gas concentrations.”

(I apologize for the nearly illegible size… The Purdue website offers up the diagram in the teeny-tiny size above, or print quality, which I assumed would be excessive.)

There are a couple of things I find odd (and counterintuitive and frankly counterproductive) about the diagram…

Firstly, the color spectrum used in this false-color representation of the data feels wrong to me, since it ranges from cool blues through warm oranges and reds and thence to… The beginnings of a cool violet? Particularly since we’re talking about temperature (well, sort of) here, and most people have grown accustomed to weather maps colored by temperature. Stopping at red gives you plenty of color resolution. (And maybe next time, you can choose something other than the garish rainbow colors?)

A more egregious error permeates the diagram, however. Perhaps we can simply call this the “apples and oranges&rduo; issue: two images, side-by-side, offered up for comparison, need to share enough to allow for easy comparison. I last blogged about this in relation to an NCAR visualization of Hurricane Katrina, but the idea is simple enough: don’t ask the viewer to do unnecessary work in interpreting your imagery, because unnecessary work leads to unnecessary risk of miscommunication. In the case of the two images above, the color bars are flipped for no apparent reason, so increasing values get warmer (in hue) on the top and cooler (in hue) on the bottom. Why? Also, the scale of the two color bars changes, running from 3 to 8 on top and from –3 to 0 on the bottom. Why? Why? Why?

(Well, okay, I can acknowledge one drawback in this particular case. Since the two datasets do not overlap, coming up with a single colorbar would be a little tricky; indeed, you’d almost need to insert an intermediate model showing, say, no change in greenhouse admissions, which would presumably result in values in between. But the issue of inverting the colorbar still stands: “red on top bad, red on bottom goooood” simply leads to confusion.)

I find behavior of this sort annoying when watching a scientist presenting data in a talk, but as part of a press release, it just saddens me. My fear is that the folks in the university press offices don’t even try to fix these problems… Perhaps because they don’t care, but perhaps because they don’t even think the data should be easily understood.

Hmmm. Maybe it’s time for a Tufte-like “Graphics 101” for science types? I looked for such a thing just now, but I didn’t find anything. Anyone reading know of such a thing?
Skytruth


The above images come from Skytruth, a non-profit “using remote sensing and digital mapping to educate the public and policymakers about the environmental consequences of human activities.” On the top, you can see Wyoming’ Upper Green River Valley in 1986, and on the bottom, in 2005, after the construction of approximately 700 natural gas wells. The organization’s website offers more details on the particular events in Wyoming (and many, many other places on Earth), but the main point should be clear: data speaks!

I just saw a presentation by Skytruth’s founder, John Amos, at the International Symposium on Digital Earth. Blogging while he spoke… Hope he’s not offended.

Visualizing Science Education

Funny. I just got out of a meeting in which we were discussing public perceptions of science and the role of formal education. Then I see this comic: bored students learning (sans even rudimentary visuals) one of the most exciting results of modern cosmology. And made to feel small to boot!

Oddly enough, the kids’ science class is apparently taught by the brunet half of Hall and Oates, which would have made him no cooler in my generation than he is in this.

A Pup out of Water

A brief thought for the day. How does it make you feel, knowing that the image above represents fully seven percent of the world’s population of Devil’s Hole pupfish?

Interesting how knowledge changes context. A San Francisco Chronicle article from today discusses the fate of the pupfish, and it’s not exactly rosy. Forty-two of the fish remain, and the population doesn’t appear to be on the rise. But above, you see a picture of a few—a few members of a species about to disappear forever. How does knowing that change the image?

Periodic Spirals—and the Third Dimension

I ran across an image similar to the above on page 86 of Philip Ball’s marvelous little The Elements: A Very Short Introduction, part of an impressive series from Oxford University Press. (I highly recommend these wee volumes, which offer a lot of bang for the buck, at least in the limited selection of titles I’ve perused.)

Anyway, the image. It shows the “lemniscate spiral” of a certain William Crookes (not exactly a household name, but an interesting fellow nonetheless). I have previously blogged about the periodic table, but I find this attempt particularly intriguing. Crookes was trying to visualize the relationship between various elements in three dimensions, which is the kind of thing we do without thinking nowadays, but in the late 19th Century… Of course you’d have to try constructing a convoluted contraption to convey your idea!

That’s what I find interesting about the image: a 19th-century scientist would use an image depicting the hypothetical three-dimensional object in physical terms. Because the abstraction of three dimensions could not (easily) be conveyed pictorally without reliance on real-world elements to suggest the construct extending outside the plane of the printed page. Honestly, I have no idea whether Crookes physically constructed his “lemniscate spiral” or not, but I’m guessing not. Which is what makes me think this the image is a way of communicating the idea.

Whereas modern tools allow us to visualize data in three dimensions and, at some level, conceive of things in three dimensions, such virtual luxuries were unavailable to Crookes and his contemporaries. Thus the conceit of the physical object.

Interestingly, I know of no modern three-dimensional visualizations of the periodic table. Perhaps someone can point me to something…? But if they exist, I bet they aren’t depicted as physical objects.

Inscrutible Ice Cube

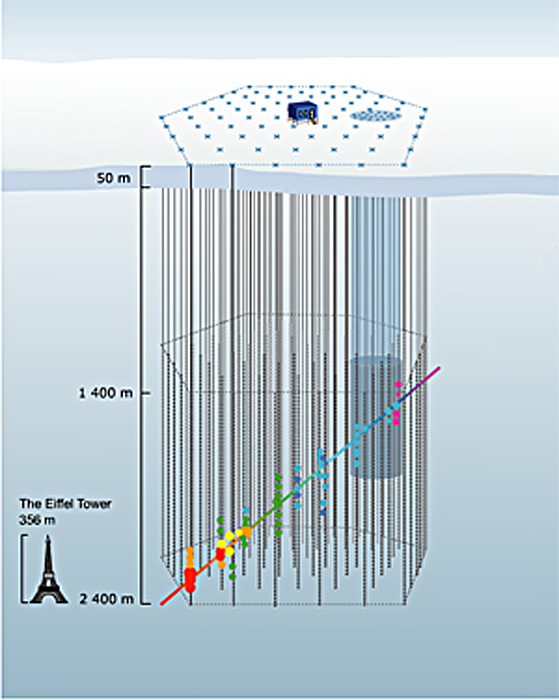
A press release from the University of Delaware uses the above image as a stand-in for a Flash animation (provided without explanation) elsewhere on their site. The caption (surprise, surprise) is utterly useless: “How does the IceCube telescope work? Click here to launch the animation, courtesy of the University of Wisconsin-Madison.” Um, thanks.

The thing is, it’s actually a nice enough animation. I like the little Eiffel Tower for scale, and the iconography is relatively clear, except for the color of the dots changing along the path… But it could certainly use some added text or something. And ironically, if you browse down the animations page and look at the very next option, you find a nicely-annotated Flash animation that actually clears up most of the confusion of the previous animation. The colors of the dots remain unexplained, but otherwise, it’s rather spiffy! (If you prefer, you can take a look at the annotated Flash in Swedish, too.)

So what gives? I hope it wasn’t a conscious decision to eschew the animation with text and supporting verbiage! “Oooh, it looks so cluttered that way.”) But the alternative explanation is plain sloppiness. Hmmm.